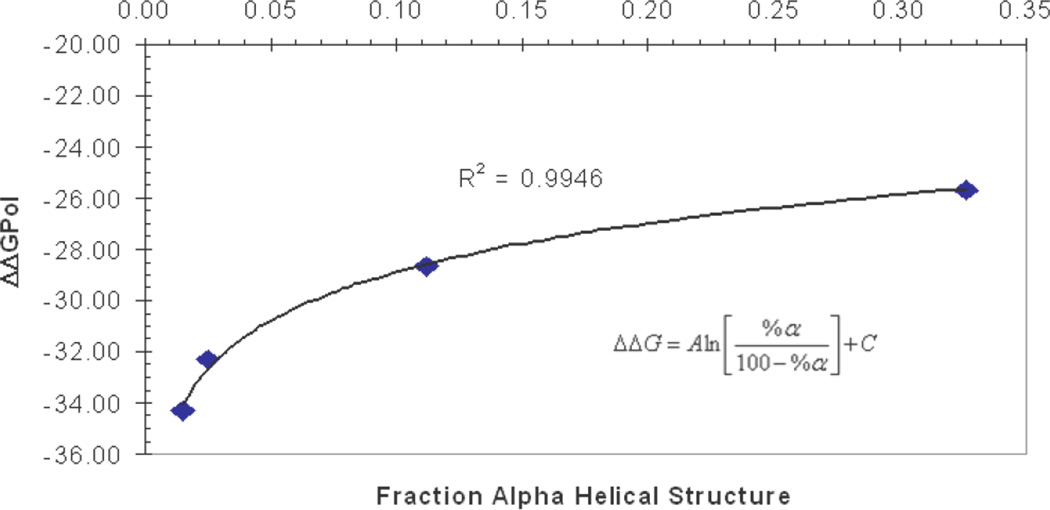
Figure 3.
Plot of fractional α-helical structure (%α/[100−%α]) obtained from DSSP analysis of REMD simulations with various solvent models versus the corresponding ΔΔGPol value between the PP2 and Alpha conformations. The data points from right to left are for the GBNeck, TIP3P, GBOBC, and GBHCT solvent models. As the solvation free energy gap in the given solvent model between the PP2 and Alpha structures decreases, the amount of α-helical structure in simulations with that model increases.

