Figure 2.
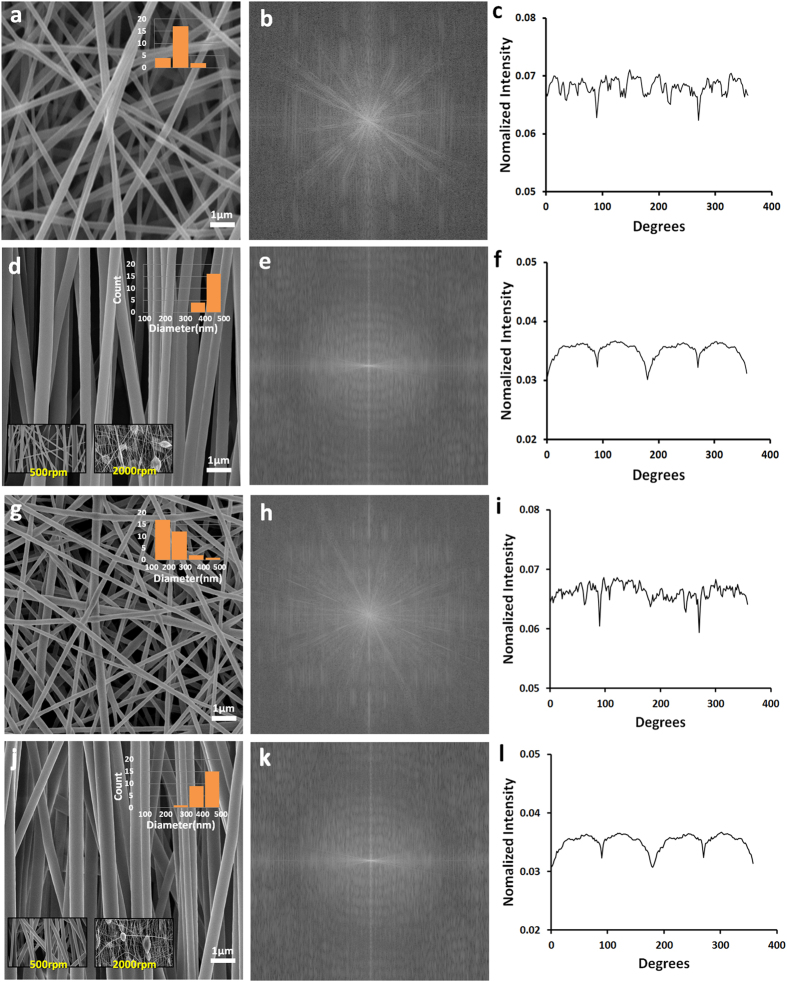
Morphological analysis of PU and PLGA nanofibrous mat with diameter graph (a) SEM image of randomly oriented PU nanofibers (d) SEM images of aligned PU nanofibers at a speed of 1000 rpm. inset; 500 rpm and 2000 rpm (g) SEM image of randomly oriented PLGA nanofibers (j) SEM images of aligned PLGA nanofibers at a speed of 1000 rpm, 500 rpm and 2000 rpm (b,e,h,k) FFT output images (c,f,I,l) Pixel intensity plots against the angle of acquisition for the aligned and random nanofibers.

