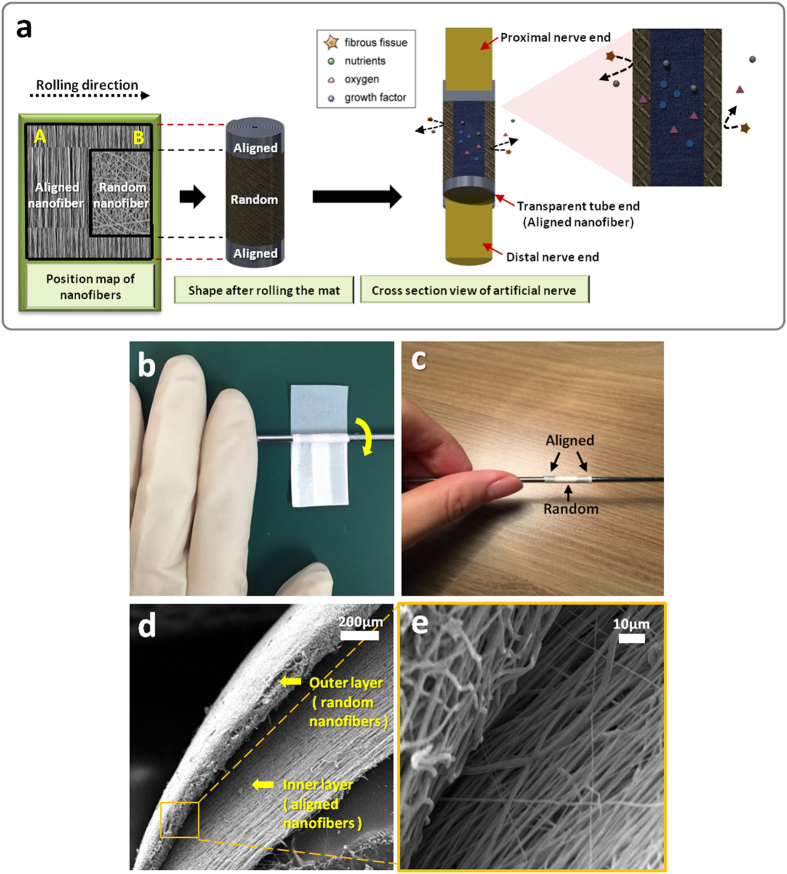
Figure 3.
(a) Schematic 3D illustration of the nerve guide conduit (the position map of nanofiber, shape after rolling the mat and cross section view of the conduit is shown in this figure) (b,c) SEM images of the cross section view of the nerve tube (d) A digital photo of rolling the angled U shape mat on a rod (e) A digital photo of the nerve guide conduit after rolling.

