FIG 1.
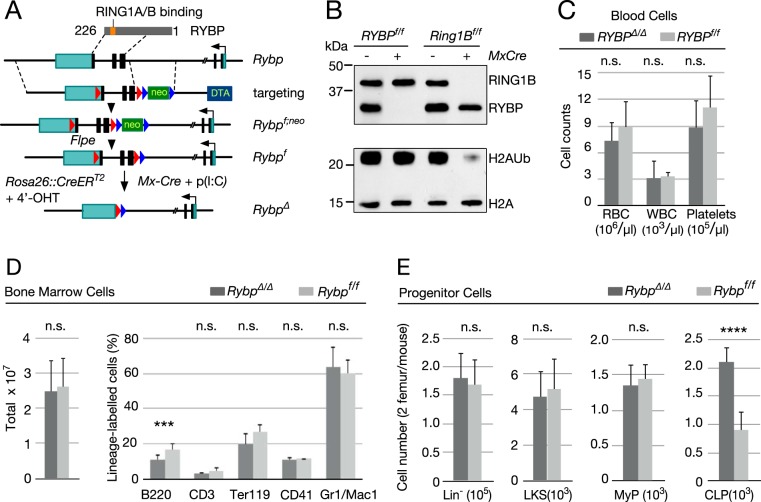
Analysis of Rybp-deficient hematopoietic cells. (A) Schematic representation of strategy used to conditionally inactivate Rybp. (Top) Rybp cDNA denoting Zn finger (ZnF) and C-terminal region that interacts with Polycomb RING1A and RING1B. Rybp coding sequences are shown as black rectangles, and 5′ and 3′-UTR sequences are shown as green rectangles; the broken line in the Rybp locus is due to the large size of intervening sequence that is not represented at the scale used. Dashed lines delineate homology arms contained in the targeting construct, interrupted by a neo cassette flanked by frt sites (blue arrowheads); Rybp coding sequences and the neo cassette are flanked by loxP sites (red arrowheads). The Rybpf allele was generated by mating Rybpf;neo mice to transgenic mice expressing FLPE recombinase. Subsequent mating to MxCre mice or to mice expressing a Cre-ER fusion allowed for in vivo or ex vivo inactivation after poly(I·C) injection or exposure to 4′-hydroxytamoxifen (4′-OHT), respectively. (B) H2AUb levels in Rybp-depleted hematopoietic cells. Shown are representative Western blots of total lysate (top) or histone (bottom) extracts from cKit+ cells from mice of the indicated genotypes. Extracts from Ring1B-deficient hematopoietic cells (on the right) were used as controls. On the left are molecular mass markers. (C) Absolute numbers of circulating cells in Rybpf/f (Cre−) and RybpΔ/Δ (Cre+) mice. RBC, red blood cells; WBC, white blood cells. (D) Bone marrow cells from mice of the indicated genotype. Left, total absolute cell numbers. Right, relative numbers of lineage markers: B and T cell (B220+ and CD3+, respectively), erythroid (Ter119+), megakaryocytic (CD41+), and myeloid (Mac1+/Gr1+). (E) Absolute numbers of immature cell populations from mice of the indicated genotype. Lineage marker-negative bone marrow cells (Lin− population, containing HSCs and all progenitor cells), Lin− ckit+ Sca1+(LKS population, including long- and short-term HSCs), Lin− Sca1− ckit+ (MyP population, corresponding to myeloid progenitors), and Lin− Sca1lo ckit+ IL-7+ (CLP population, corresponding to common lymphoid progenitors) were used. Ten (C and E) or 20 (D) mice were analyzed for each genotype. Data are mean values and standard deviations (SD). ****, P ≤ 0.0001; n.s., not statistically significant (P ≥ 0.05).

