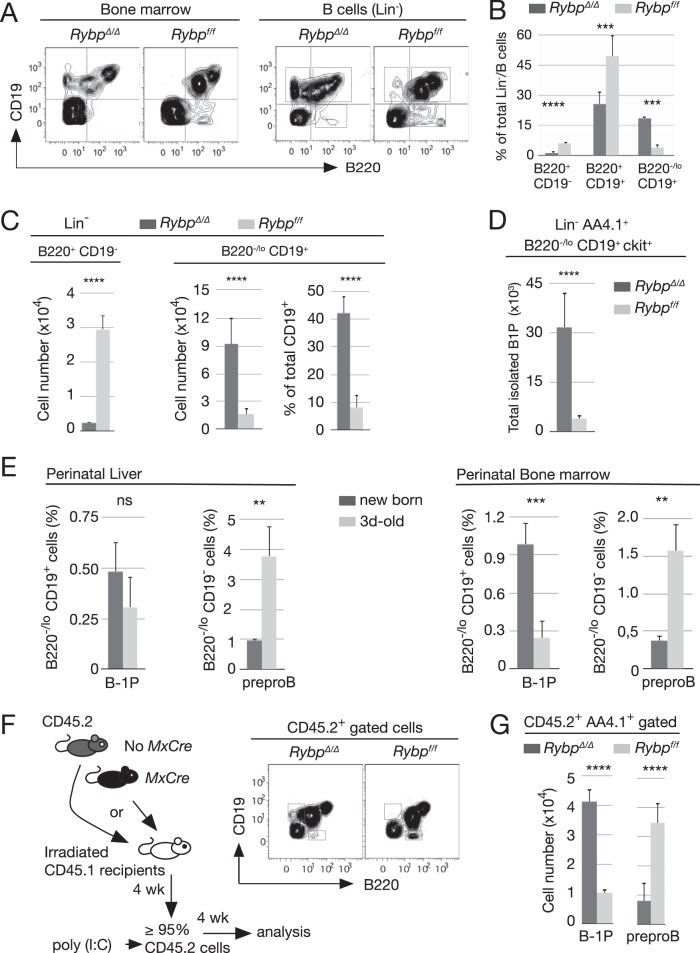
FIG 2.
Cell-autonomous reversal of the B-1 progenitors to pre-proB cell ratio in Rybp-deficient bone marrow. (A) Representative flow cytometry plots of total bone marrow cells or of Lin−/B cells (lineage-depleted cells, except for B220) labeled with antibodies against B220 and CD19 markers. (B) Relative size of B-cell subpopulations (gated as indicated in the corresponding plots) from control (Rybpf/f) and mutant (RybpΔ/Δ) Lin−/B220 cells. (C) Absolute and relative cell numbers of B220−/lo CD19+ and B220+ CD19− subsets within Lin− CD19+ (left) or Lin− B220+ (right) populations in mice of the indicated genotypes. (D) Increased cell numbers of mutant B1 progenitors (Lin− AA4.1+ B220−/lo CD19+ ckit+). (E) B220/CD19-labeled cells in newborn and mice at day 3. Bar graphs show means and SD of relative contents in Lin− CD19+ B220−/lo and Lin− CD19− B220med populations of six pups/experiment from two independent experiments. (F, left) Schematic representation of hematopoietic transplantation of 5 × 10⁶ total bone marrow CD45.2+ Rybpf/f Cre− or Cre+ cells into lethally irradiated CD45.1+ mice; 4 weeks later, hosts in which ≥90% of circulating cells were CD45.2+ were treated with poly(I·C) and sacrificed for analysis 4 weeks later. (Right) Representative plot of B220/CD19-labeled cells. (G) Absolute number of donor B220−/lo CD19+ and B220+ CD19− compartments containing B1 progenitors and pre-proB cells, respectively, of the indicated genotypes. Data are from two independent experiments (n = 6 and n = 4 for each genotype in transplants 1 and 2, respectively). Bar graphs show mean values and SD. In panels B and C, ten mice were analyzed of each genotype. **, P ≤ 0.01; ***, P ≤ 0.001; ****, P ≤ 0.0001; n.s., not statistically significant (P ≥ 0.05).

