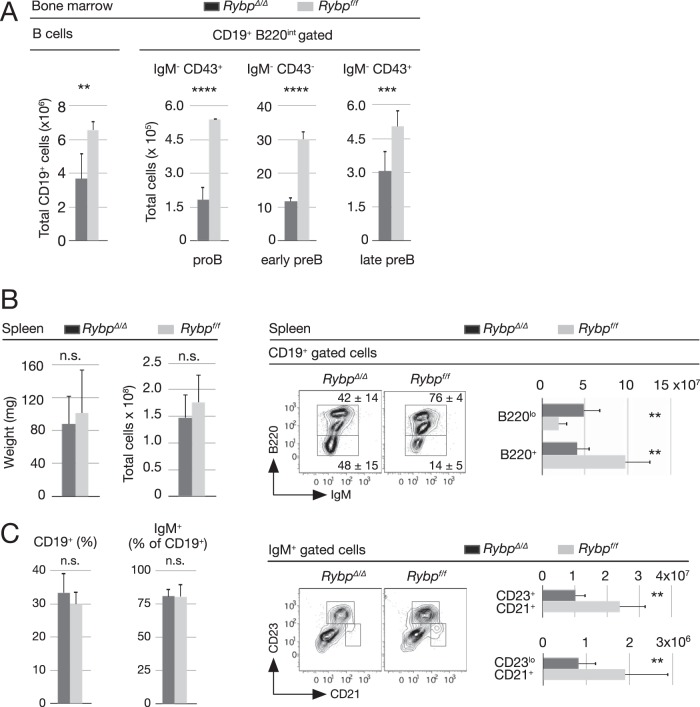
FIG 5.
Decreased numbers of bone marrow and spleen Rybp-deficient B-2 B-cell precursors. (A) Absolute number of total bone marrow B cells (CD19+) and of subpopulations among early precursor CD19+ B220med populations, i.e., proB (IgM− CD43+), early preB (IgM− CD43−), and late preB (IgM+ CD43−) subsets from mice of the indicated genotypes. (B) Size of spleens (weight, cellularity) and content of CD19+ and IgM+ cells in control and mutant mice. (C) Splenic B-cell populations. Representative flow cytometry plots of control and mutant CD19+ cells (top) show mean percentages and SD of populations within drawn boxes and their absolute numbers (bar graph). Also shown are representative flow cytometry plots of control and mutant IgM+ cells and absolute numbers (bar graphs) of follicular (CD21lo CD23hi) and marginal-zone (CD21hi CD23lo) populations. Bar graphs show means and SD from analyzed mice (n = 8 [A and B] and n = 10 [C and D]). **, P ≤ 0.01; ***, P ≤ 0.001; ****, P ≤ 0.0001; n.s., not statistically significant (P ≥ 0.05).

