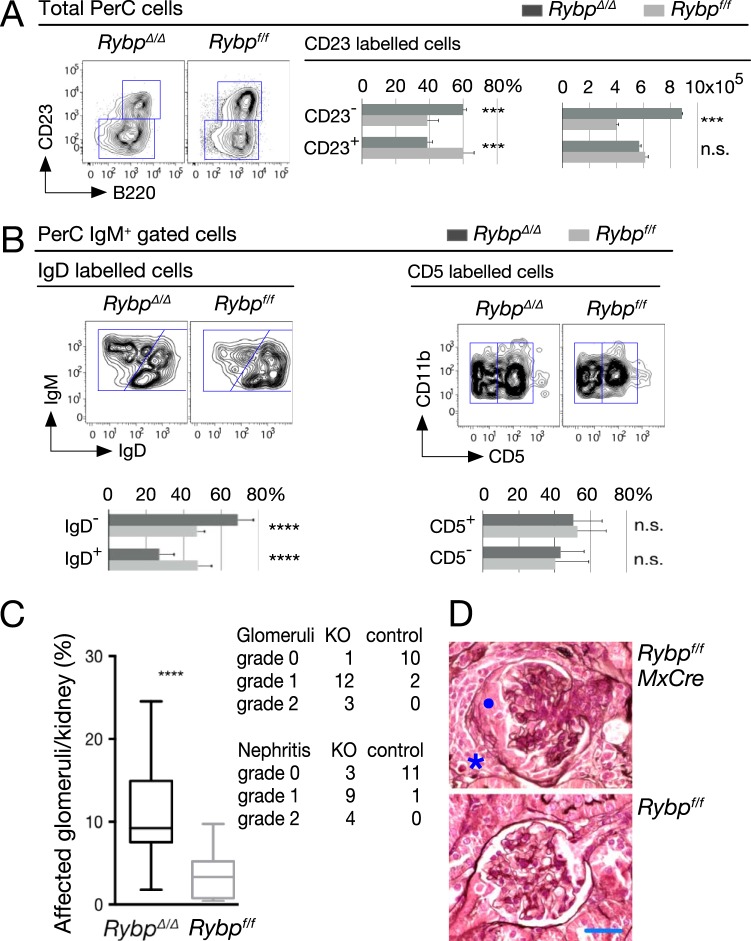
FIG 6.
Peritoneal B-1 B cells and kidney disease in Rybp-mutant mice. (A and B) Representative flow cytometry plots and quantitation of the indicated subpopulations of the peritoneal cell cavity (PerC) in mutant and control mice showing increased absolute numbers of B-1 cells (A, bar graph on the right), increased B-1 to B-2 pool ratios (A, bar graph on the left, and B, left), and unaltered distribution of B-1a (CD5+) and B-1b (CD5−) subsets of CD11b+ cells (B, right). B-1 cells, B220lo/+ CD23− IgM+ IgDlo; B-2 cells, B220+ CD23+ IgM+ IgD+. Bar graphs show means and SD (n = 4 [A] and n = 10 [B]). *, P ≤ 0.05; ***, P ≤ 0.001; ****, P ≤ 0.0001; n.s., not statistically significant (P ≥ 0.05). (C) Glomerular lesions, box plot, and severity of interstitial nephritis foci in mice of the indicated genotypes. (D) Representative hematoxylin- and eosin-stained sections showing control (Rybpf/f) and unaffected glomerulus (RybpΔ/Δ). Note the tuft in the center of the mutant renal corpuscle compressed by a fibrocellular crescent (•), accompanied by a loss of capillary lumen. In addition, a mononuclear cell infiltrate (*) is found in the medullary interstitium. Scale bar, 25 μm. Bars in the box plot are median values (n = 16 [mutant]; n = 13 [control]); ****, P = 0.0003.

