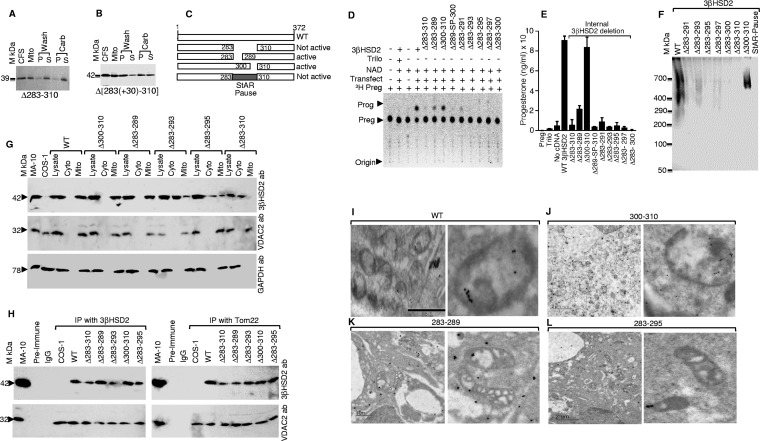
FIG 2.
Role of amino acids 283 to 310 in mitochondrial import of 3βHSD2. (A) Analysis of 35S-Δ283-310 3βHSD2 import into the isolated mitochondria and identification of compartmentalization by centrifugation followed by washing with sodium carbonate. (B) Replacement of amino acids 283 to 310 with the 30-amino-acid StAR pause sequence in 3βHSD2 and analysis of its import into isolated mitochondria as in panel A. (C) Schematic presentation of the different internal amino acids from positions 283 to 310 and also substitution of the sequence of the StAR pause sequence from 31 to 61 amino acids. (D) Analysis of the metabolic activity of the indicated 3βHSD2 deletion mutants after cotransfection of COS-1 cells with the F2 vector. Transfect, transfection. (E) Quantitative measurement of the amount of progesterone synthesized in panel D. Data represent the means plus SEM for three independent experiments performed at three different times. (F) Identification of 3βHSD2 mutant-containing complexes after cell-free synthesized 35S-3βHSD2 was imported into mitochondria isolated from MA-10 cells, solubilized with digitonin, and analyzed by 6 to 16% native gradient PAGE. (G) Compartment-specific localization of WT and mutant 3βHSD2 after overexpression in COS-1 cells followed by staining with a 3βHSD2 antibody. The fractions are mitochondria (Mito) and cytoplasm without lipids (Cyto). The middle and bottom panels show a representative Western blot of the same membrane probed with a mitochondrial VDAC2 antibody and a cytosolic glyceraldehyde-3-phosphate dehydrogenase (GAPDH) antibody, respectively. (H) Immunoprecipitation of the 3βHSD2 constructs obtained from COS-1 cells in mitochondrial extracts with 3βHSD2 (left) and Tom22 (right) followed by Western blotting with a 3βHSD2 (top) and VDAC2 (Bottom) antibodies. (I to L) Electron microscopic analysis of WT 3βHSD2 (I), 300-310 3βHSD2 (J), 283-289 3βHSD2 (K) and 283-295 3βHSD2 (L). The right panels show an enlarged view of a mitochondrion from the respective left panels. Bars, 0.5 μm (I), 1.0 μm (K), and 2.0 μm (J and L).

