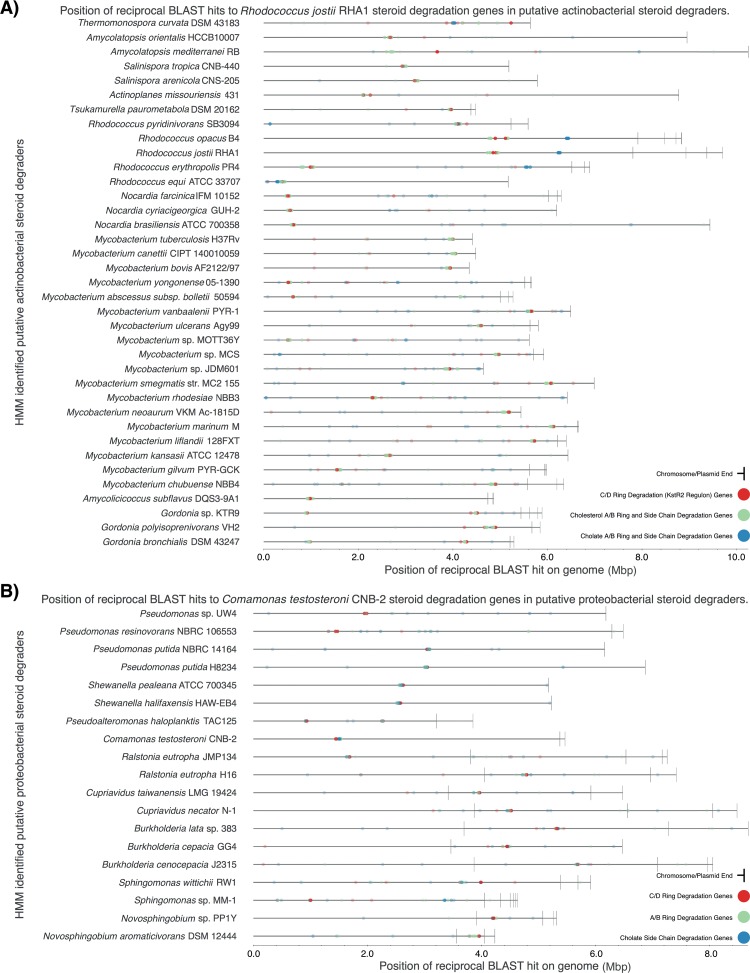
FIG 4 .
Localization of steroid catabolism genes in genomes. The genes and their functional groupings are as described for Fig. 2 and 3. Each gene is mapped by a translucent dot, so areas of intense color indicate clusters with many genes. (A) Rhodococcus jostii RHA1. (B) Comamonas testosteroni CNB-2.

