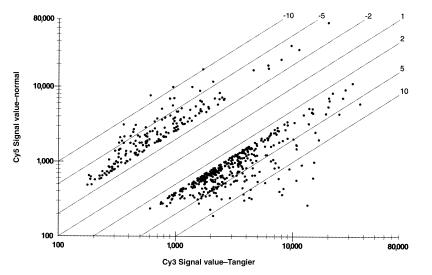
Figure 1.
Gene expression microarray analysis. Six Gene Album™ microarrays, containing a total of 58,800 human cDNAs, were hybridized with cDNA labeled with Cy3 dye prepared from RNA from cAMP-treated TD1 cells, and with cDNA labeled with Cy5 dye from cAMP-treated normal cells as described in Methods. Spots indicate the relative expression of the 175 genes more than 2.5-fold under expressed in the TD cells compared with normal cells (above and to the left of the diagonal) and the 375 genes greater than 2.5-fold more abundantly expressed in the TD cells than in normal cells. For clarity, the other 58,250 spots that lie within the range depicted are not shown.

