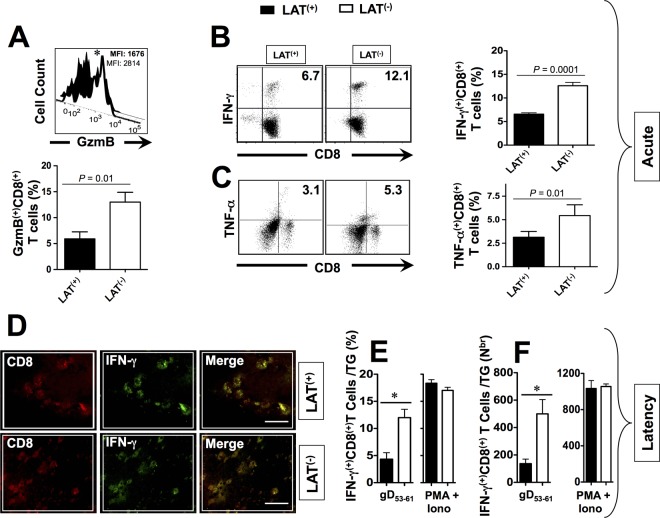
FIG 6.
HSV-specific CD8+ T cells that are retained in HSV-1 LAT+ infected TG are functionally exhausted compared to CD8+ T cells from HSV-1 LAT– infected TG. Three groups of HLA Tg rabbits (n = 10) were ocularly infected with the wild-type McKrae (LAT+), its LAT-null virus mutant dLAT2903 (LAT–), or the marker-rescued virus dLAT2903R counterpart (LAT+). At 12 (Acute) and 35 (Latency) days postocular infection, 10 TG from five rabbits/group were harvested and pooled, and single-cell suspensions were prepared as described above. For GzmB, cell suspensions from LAT+ TG versus LAT– TG were stimulated with HSV-1 VP11/12220–228 peptide for 6 h at 37°C in the presence of 0.7 μl/ml BD Golgi-Stop and 10 μl of FITC-labeled anti-human GzmB MAb, washed with FACS buffer, and stained with PerCP-conjugated anti-rabbit CD8 MAb at 4°C. Tetramer staining and FACS assays were used to determine the levels of expression of GzmB on HSV-1 VP11/12220–228 epitope-specific CD8+ T cells that are retained in LAT+ TG versus LAT– TG. For intracellular cytokine staining, cell suspensions from LAT+ TG versus LAT– TG were stimulated with VP11/12220–228 peptide (10 μg/ml) for 6 h at 37°C in the presence of Golgi Plug (BD Biosciences). The cells were then stained with PerCP-conjugated anti-rabbit CD8 for 30 min, permeabilized, and stained with PE-labeled anti-human IFN-γ or TNF-α antibodies. (A) Representative histogram of level of GzmB on gated VP11/12220–228 epitope-specific CD8+ T cells in LAT+ TG versus LAT– TG (upper panel). Average percentages of VP11/12220–228 epitope-specific CD8+ T cells expressing significant levels of GzmB are given in the lower panel. (B) Representative dot plots of the percentages of VP11/12220–228 epitope-specific IFN-γ+ CD8+ T cells in LAT+ TG versus LAT– TG (left panel). Average percentages/TG of VP11/12220–228 epitope-specific CD8+ T cells producing IFN-γ in LAT+ TG versus LAT– TG are shown in the right panel. (C) Representative dot plots of percentage VP11/12220–228 epitope-specific TNF-α+ CD8+ T cells in LAT+ TG versus LAT– TG (left panel). Average percentages/TG of VP11/12220–228 epitope-specific CD8+ T cells producing TNF-α in LAT+ TG versus LAT– TG are shown in the right panel. (D) TG from HLA Tg rabbits latently infected with either LAT+ or LAT– virus were removed at 35 days postocular infection, immunostained with MAbs specific to rabbit CD8 and IFN-γ, and then analyzed by confocal microscopy. The results shown are representative of four independent experiments. (E) Average percentages/TG of gD53–61 epitope-specific CD8+ T cells producing IFN-γ detected during latency in LAT+ TG versus LAT– TG, following restimulation with either gD53–61 peptide or PMA+IONO (positive control). (F) Average numbers/TG of gD53–61 epitope-specific CD8+ T cells producing IFN-γ detected during latency in LAT+ TG versus LAT– TG, following restimulation with either gD53–61 peptide or PMA+IONO (positive control). Each bar represents the mean and the SD of two independent experiments each using 10 TG. *, P < 0.05 (LAT+ TG versus LAT– TG [ANOVA]).

