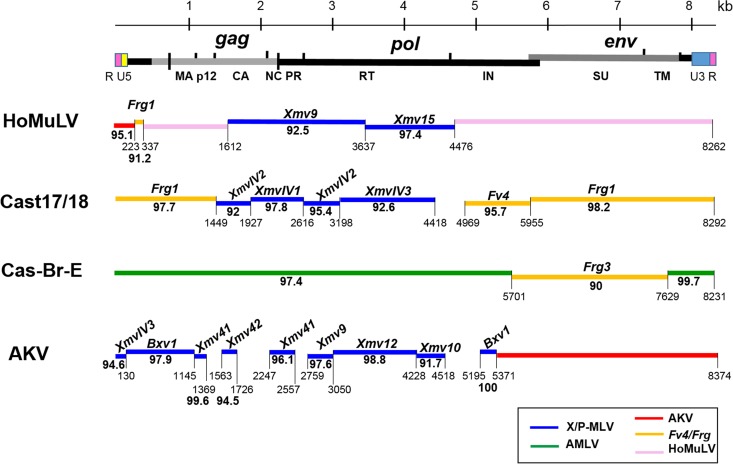
FIG 6.
Sequence relationships of three wild mouse E-MLVs and the laboratory mouse AKV E-MLV to ERVs and MLVs. At the top is a schematic representation of the viral genome. For each of the four genomes, horizontal lines represent regions of greatest identities (>90%) with ERVs or other MLVs, annotated as described for Fig. 2. The env genes and some other viral regions are E-MLV subtype specific.

