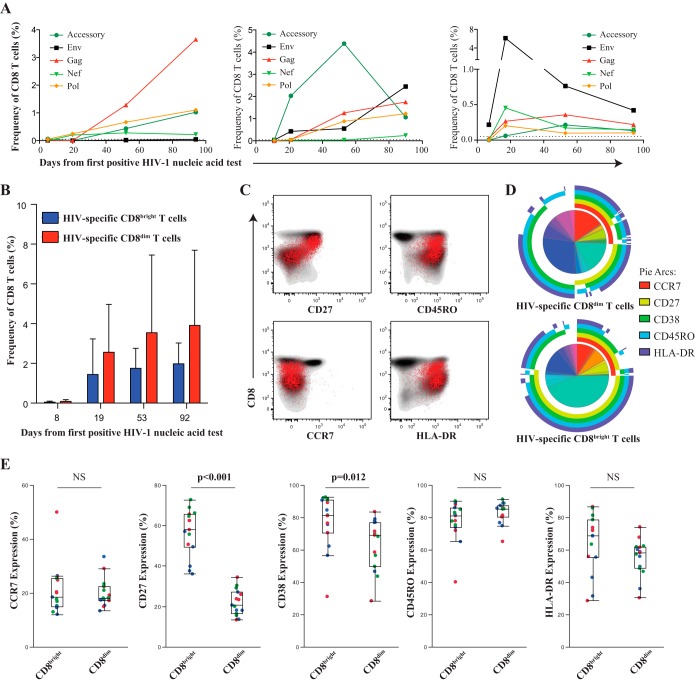
FIG 5.
HIV-1-specific CD8+ T cells within the CD8bright and CD8dim population. PBMC from three donors were chosen an average 8, 19, 53, and 93 days after the 1st RNA-positive HIV nucleic acid test. (A) Shown are the kinetics of total HIV-specific CD8+ T cell responses (CD107a, IFN-γ, and/or IL-2) in each individual measured by flow cytometry. (B) The majority of HIV-specific CD8+ T cell responses emerge from the CD8dim (red) T population. (C) Representative donor demonstrating the effector phenotype of the HIV-specific CD8+ T cell responses (in red) overlaying the total CD8 compartment (contour plot, in gray). (D) Pie charts showing average frequency of HIV-specific CD8bright and CD8dim T cells with combinatorial expression of 5 phenotypic markers assessed. Arcs show individual expression levels of each phenotypic marker. (E) Box-and-whisker plots show the relative expression of phenotypic markers between HIV-specific CD8bright and CD8dim T cells 39 days after peak viremia. Different donor responses are indicated by different colors for various peptide pools. Nonparametric comparisons were performed using the Wilcoxon method, and nonsignificant relationships are denoted as NS.

