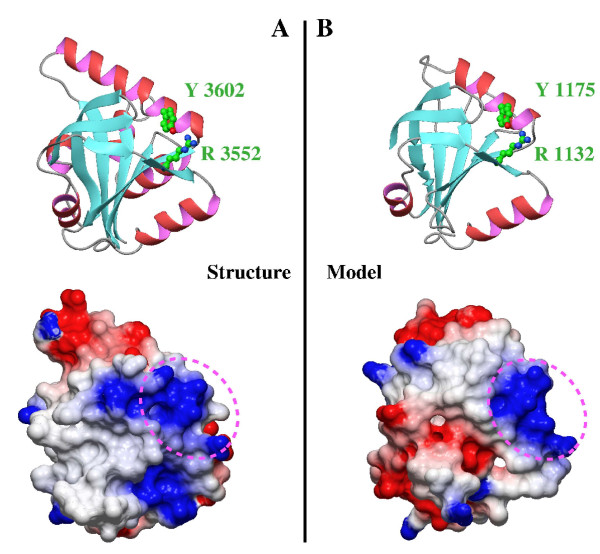
Figure 3.

Comparison of SPOC domains from SHARP and DIO proteins. (A) Ribbon representation and electrostatic surface potential map of structure of the SPOC domain of SHARP protein (PDB code: 1OW1). (B) Ribbon representation and electrostatic surface potential map of homology model of the SPOC domain of DIO protein. Blue indicates positively charged regions, whereas red shows negatively charged regions. All the molecules are in the same orientation. Dotted circles indicates the conserved basic cluster, where is located the conserved arginine-tyrosine pair.
