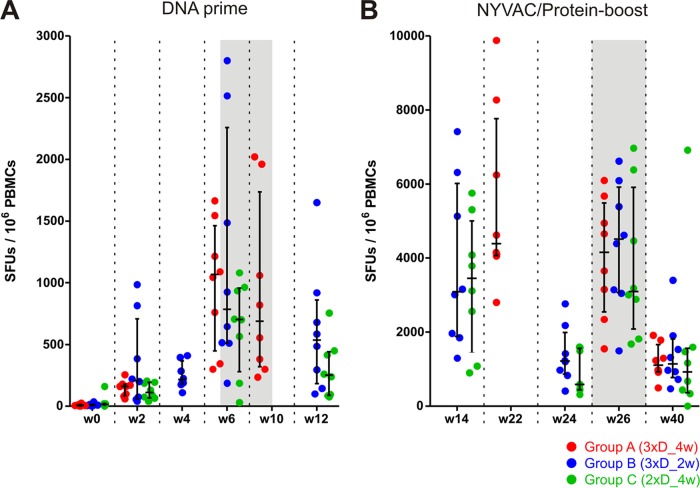
FIG 2.
All vaccination regimens induced similarly large numbers of IFN-γ-secreting T cells. Freshly isolated PBMCs collected at the indicated time points (weeks after the start of the study) were stimulated with nine different peptide pools and subjected to IFN-γ ELISpot analysis. The total numbers of spot-forming units (SFUs) per million cells for group A (3xD_4w; red), group B (3xD_2w; blue), and group C (2xD_4w; green) are shown, along with medians and interquartile ranges. (A) Responses after DNA prime immunizations. (B) Responses after NYVAC/protein boosting (note the different scales). Data sets obtained 2 weeks after the last DNA immunization and the last NYVAC/protein boost are highlighted by a shaded background.

