
Figure 5.
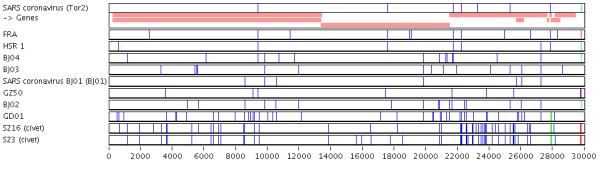
Web interface of a Base-By-Base summary. Display of 11 SARS coronavirus genomes. Pink boxes at the top of the figure represent genes; annotations are derived from the VOCs database. After comparison to the consensus, nucleotide differences are displayed as vertical blue ticks or bars, and insertions and deletions are displayed in green and red, respectively.