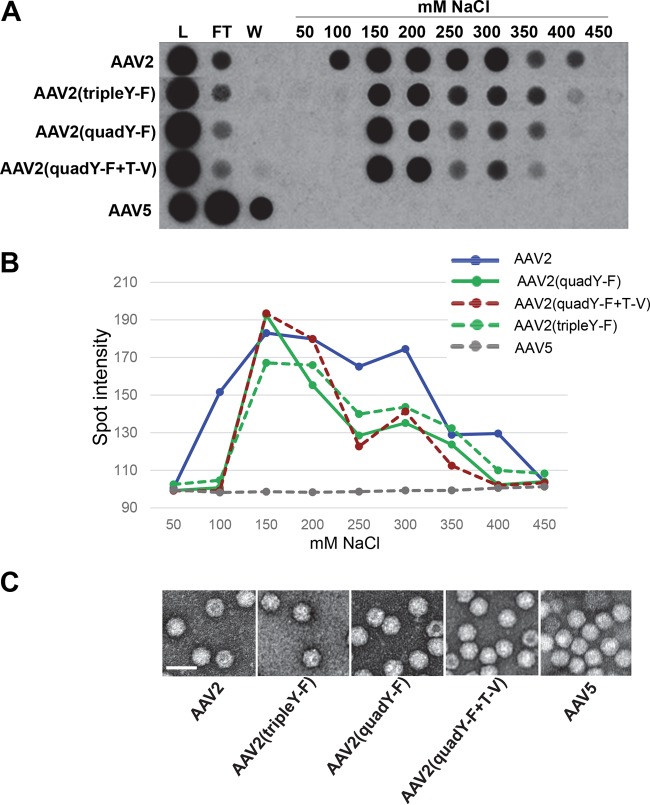
FIG 2.
Heparin binding assay and electron micrographs of various AAV2-based recombinant vectors containing tyrosine-to-phenylalanine and/or threonine-to-valine substitutions. (A) The heparin binding elution profiles of AAV2 (positive control), AAV2 mutants (tripleY-F, quadY-F, and quadY-F+T-V), and AAV5 (negative control) at different salt concentrations. (B) Quantification of HS binding data from panel A. (C) Negative-stain electron micrographs of the corresponding vectors from panel A observed at ×46,000 magnification. White scale bars are 50 nm in length and are located at the bottom left of each micrograph. L, load; FT, flowthrough; W, wash.

