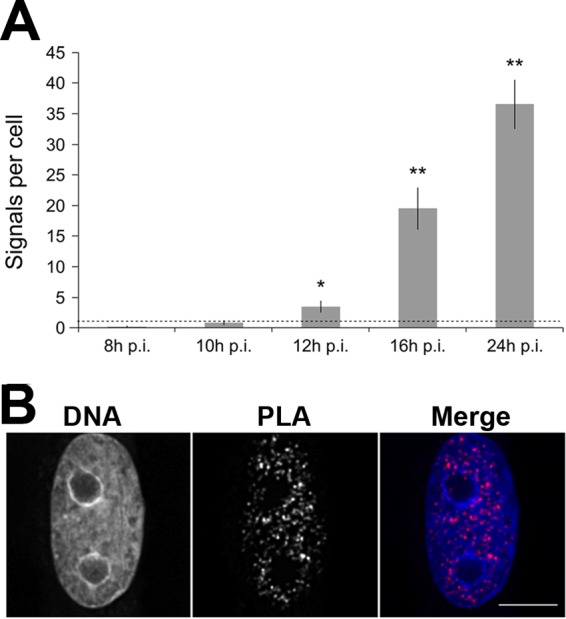
FIG 2.

In situ PLA of H3K27ac interaction with NS1 in infected cells. (A) Number of PLA signals in infected cells at 8, 10, 12, 16, and 24 h p.i. The mean values of PLA signals ± standard errors from ∼100 cells per time point are shown. The negative control, PLA signal in noninfected cells, is shown by a dashed line. Statistical significance of PLA signals per cell at 12, 16, and 24 h p.i. compared to that of the negative control is shown (P values [Student's t test]: *, P < 0.05; **, P < 0.01). (B) Distribution of PLA signals in DAPI-stained nuclei at 24 h p.i. Scale bar, 10 μm.
