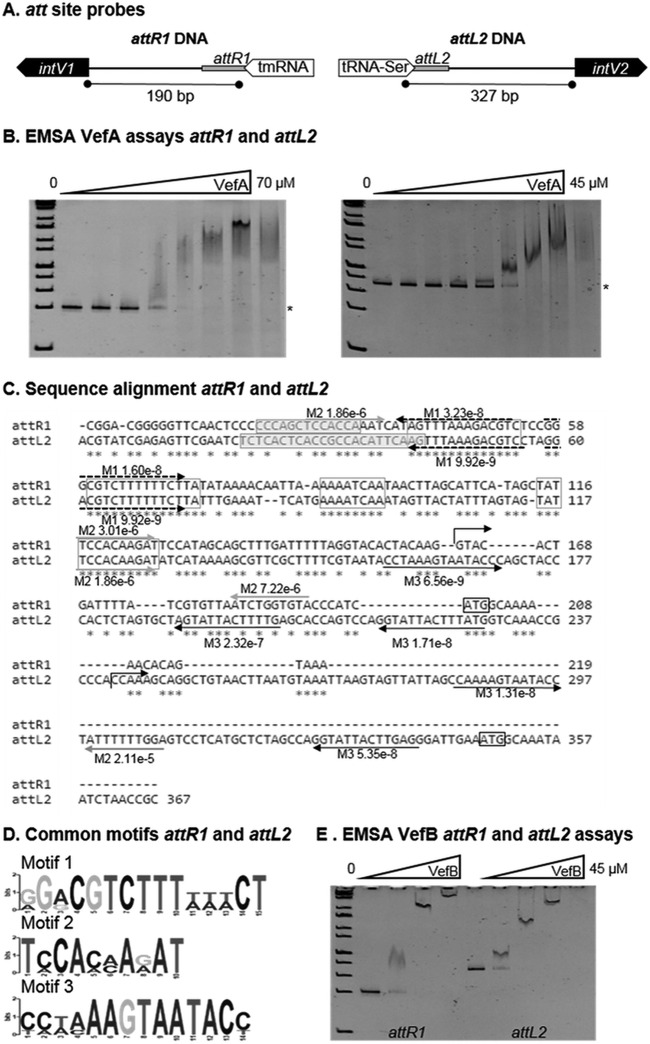
FIG 5.
VefA and VefB bind the att sites of VPI-1 and VPI-2. (A) Representation of the DNA sequences attR1 and attL2, which span from the core att site to the translational start site of intV1 and intV2 of VPI-1 and VPI-2, respectively. (B) Electrophoretic mobility shift assays (EMSAs) of the DNA fragments attR1 (30 ng) and attL2 (30 ng) with various concentrations of VefA (0 to 70 μM). Binding of VefA is observed at 10 μM and 4.1 μM for attR1 and attL2, respectively. (C) Alignment of attR1 and attL2 DNA fragments used in EMSAs. Exact repeats shared between the two sequences are boxed. Core att site sequences are boxed and highlighted. Repeated motif sequences identified by MEME are represented with arrows and their corresponding P values. (D) Logo sequences of the three motifs identified in the att sequences in panel C. (E) EMSA of the DNA fragments attR1 (30 ng) and attL2 (30 ng) with various concentrations of VefB (0 to 20.5 μM). Binding of VefB is observed at 2.5 μM and 1.4 μM for attR1 and attL2, respectively.

