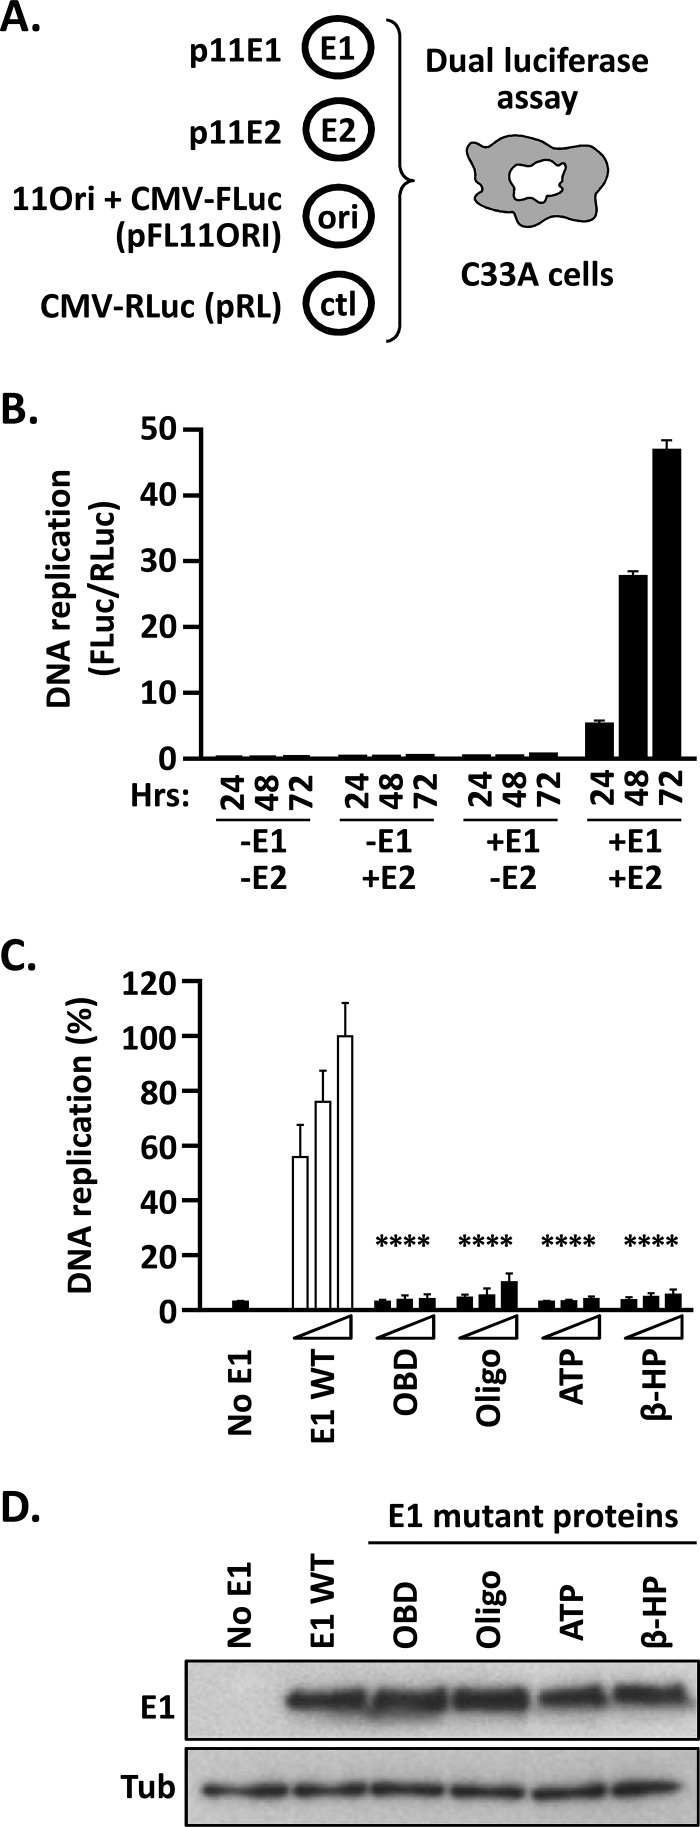
FIG 2.
Luciferase reporter cell-based assay for HPV11 DNA replication. (A) Principle of the HPV11 DNA replication assay. Expression vectors for GFP-tagged HPV11 E1 (p11E1) and triple-Flag-tagged HPV11 E2 (p11E2) are transfected into C33A cells, together with a plasmid containing the HPV11 minimal origin of replication (ori) linked in cis to an FLuc reporter gene (pFLORI11). A nonreplicating plasmid (pRL) encoding RLuc is used as an internal control (ctl). In this assay, replication of the origin-containing plasmid pFLORI11 is detected as an E1- and E2-dependent increase in FLuc activity relative to the level of RLuc expression from the control plasmid, pRL. DNA replication levels are presented as FLuc/RLuc activity ratios measured using a dual-luciferase assay. (B) Dependence of the HPV11 DNA replication assay on E1 and E2 expression as a function of time. DNA replication levels are presented as FLuc/RLuc ratios, measured in C33A cells that were cotransfected with 2.5 ng of pFLORI11 and 0.5 ng of pRL, together with (+) or without (−) 10 ng of p11E1 (E1) and 10 ng p11E2 (E2), as indicated. DNA replication levels were measured at different time points posttransfection (24, 48, and 72 h). Standard deviations are indicated by the error bars. Control assays performed in the absence of p11E1, p11E2, or both expression vectors showed no viral DNA replication. (C) Validation of the assay with replication-defective E1 mutant proteins. Shown are DNA replication activities supported by the indicated E1 proteins carrying deleterious amino acid substitutions in the OBD (K286A/R288A), Oligo (F393A), Walker A box (ATP) (K484A), and β-hairpin (β-HP) (K551A/H552A). DNA replication levels were measured from cells transfected with three different amounts of E1 expression plasmid (2.5, 5, and 10 ng) or with an empty vector as a negative control (No E1). Replication activity was measured 72 h posttransfection and is reported as a percentage of the FLuc/RLuc ratio obtained with 10 ng of wild-type E1 expression plasmid (WT), which was set to 100%. Standard deviations are indicated. Statistical significance was assessed by comparing the DNA replication activity of each E1 mutant protein to that of wild-type E1 (white bars), using one-way ANOVA followed by Dunnett's post hoc analysis. Significant differences are indicated (****, P ≤ 0.0001). (D) Expression levels of the indicated E1 mutant proteins compared to wild-type E1. Extracts from transfected cells were separated on an SDS-12% PAGE gel prior to immunoblotting with an anti-GFP antibody. Tubulin (Tub) was used as a loading control.

