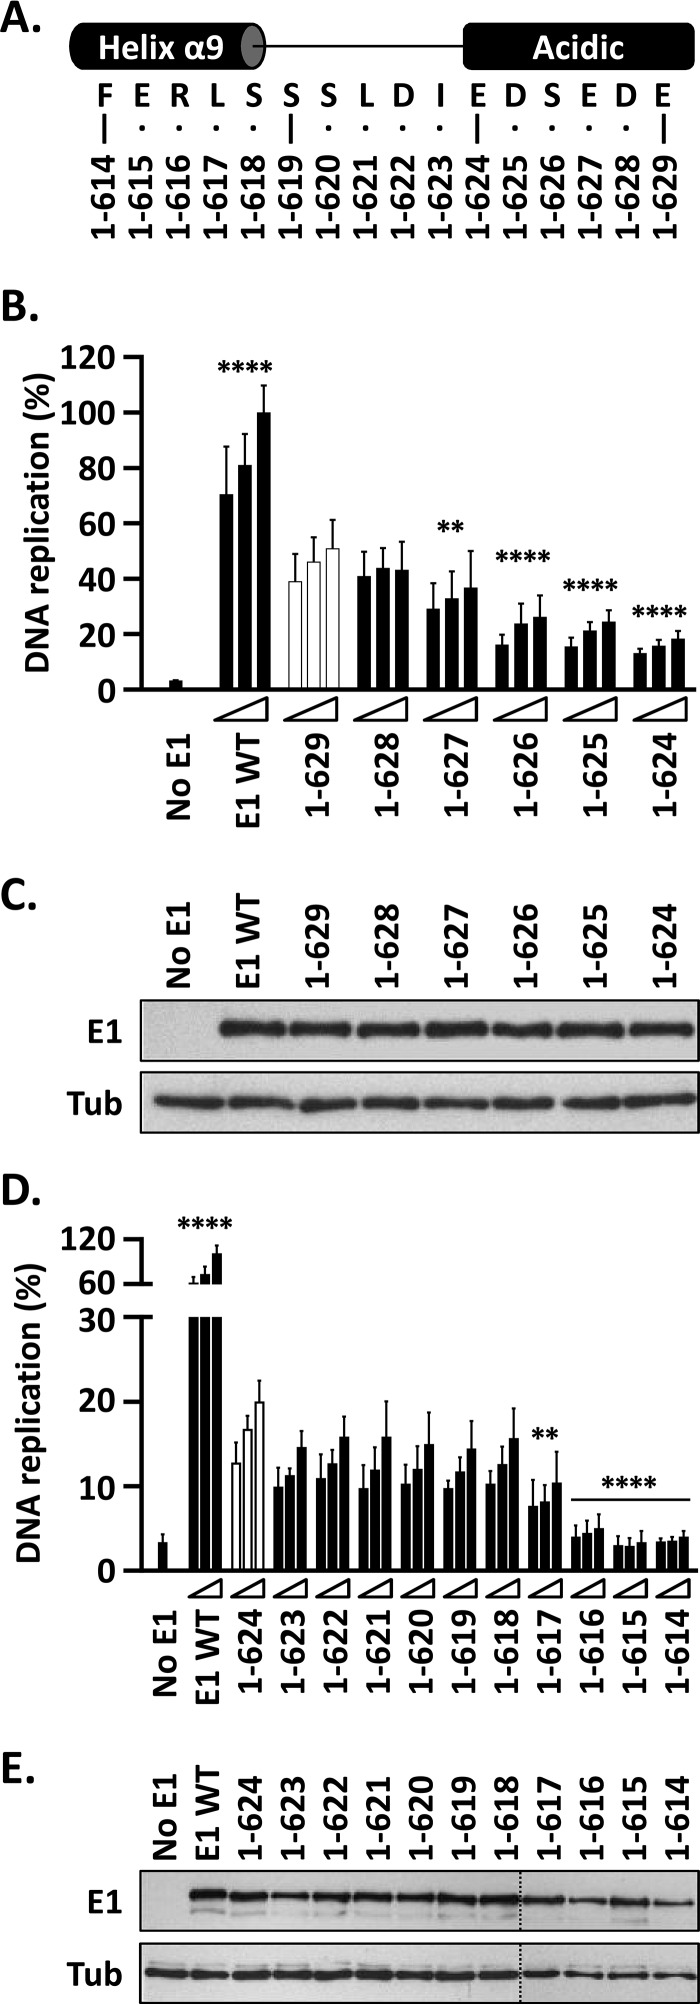
FIG 4.
The DNA replication activity of E1 is reduced by C-terminal deletions that remove the AR and abolished by those that encroach into helix 9. (A) Representation and amino acid sequence of a portion of the E1 C terminus encompassing the end of helix α9, the linker region, and the acidic region. The C-terminal boundaries of the different truncated E1 proteins are indicated. (B) Deletions into the AR. Shown are the DNA replication activities of E1 proteins ending between residues 629 and 624. In addition to lacking the C-tail, these proteins lack increasingly larger portions, in single-amino-acid increments, of the AR. The activity of each protein was determined using three amounts of E1 expression vector (2.5, 5, and 10 ng) 72 h posttransfection and is reported as a percentage of the activity obtained with 10 ng of wild-type E1 expression plasmid (WT), as described in the legend to Fig. 3B. Statistical significance was assessed by comparing the DNA replication activity of each E1 protein to that of E1(1–629) (white bars) using one-way ANOVA followed by Dunnett's post hoc analysis. Significant differences are indicated (**, P ≤ 0.01; ****, P ≤ 0.0001). (C) Expression of GFP-tagged wild-type E1 and truncated derivatives. Extracts from transfected cells were separated on an SDS-10% PAGE gel prior to immunoblotting with an anti-GFP antibody. Tubulin was used as a loading control. (D) Deletions into the linker region and helix 9. Shown are the DNA replication activities of truncated E1 proteins lacking increasingly larger portions of the linker region and helix 9. DNA replication levels and statistical significance relative to E1(1–624) (white bars) were determined as described for panel A. (E) Expression of the indicated GFP-E1 proteins was determined as described for panel C.

