FIG 1.
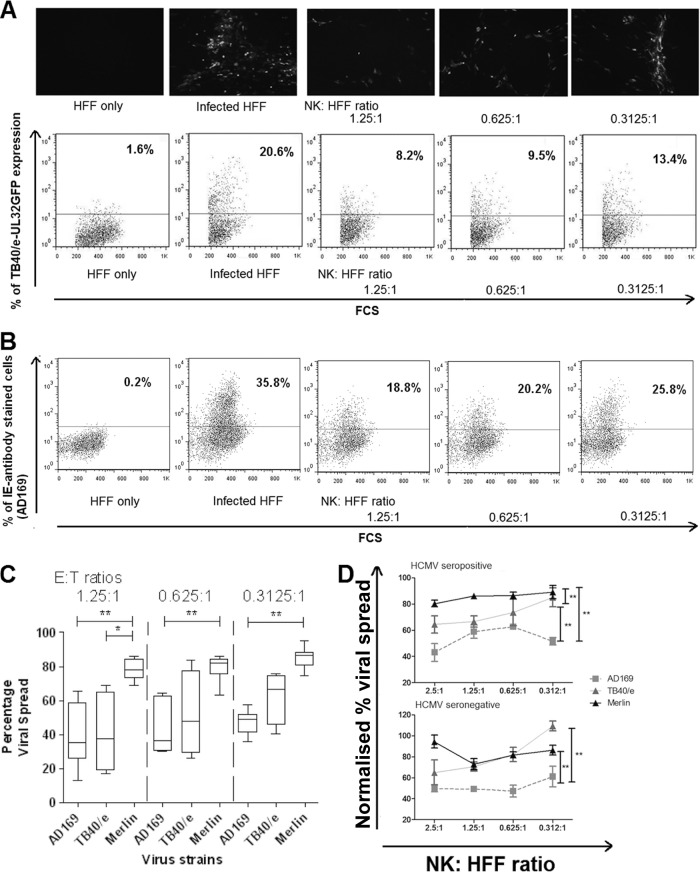
Establishment of viral dissemination assay. (A) Human fibroblasts (HFFs) infected with HCMV strain TB40/e UL32-GFP at an MOI of 0.1 and in vitro-expanded NK cells were cocultured for 9 days at various effector-to-target (E/T) ratios, starting from 1.25:1 to 0.3125:1, at 37°C and 5% CO2. NK cells were then washed off, and the HFFs were observed by fluorescence microscopy (top panel) or following trypsinization analyzed by flow cytometry (bottom panel). Representative dot plots show the results from uninfected and infected controls and the change percentage of fluorescent cells following coincubation with different ratios of NK cells to HFFs. (B) The assay was also performed using HFFs infected with untagged AD169 at an MOI of 0.1. The cells were stained intracellularly with anti-IE-Alexafluor488 antibodies before being analyzed by flow cytometry. (C) Summary results of dissemination assays on NK cells derived from 7 donors using AD169-infected HFFs, from 4 donors using TB40/e-infected HFFs, and from 9 donors using Merlin-infected HFFs. The MOI used was 0.1, and various effector-to-target (E/T) ratios from 1.25:1 to 0.3125:1 were used. At the end of the assay, TB40/e-infected or Merlin-infected HFFs were analyzed by flow cytometry without additional staining, while AD169-infected HFFs were stained with anti-IE-Alexa Fluor 488 antibody before analysis by flow cytometry. Data were analyzed by one-way ANOVA, and significant results (*, P < 0.05; **, P < 0.01) are indicated. (D) Three separate dissemination assays using HCMV strain AD169, TB40/e, or Merlin at an MOI of 0.1 were conducted using in vitro-expanded NK cells from either a seropositive donor (donor 319) or a seronegative donor (donor 401). The data were normalized according to the uninfected and infected controls. The black triangles are results from Merlin-infected HFF; gray triangles are TB40/e-infected HFF; and gray squares are AD169-infected HFF. Each data point represents 3 independent readouts, and error bars represent the standard errors of the means (SEM). Data were analyzed by two-way ANOVA, and significant results (*, P < 0.05; **, P < 0.01) are indicated.

