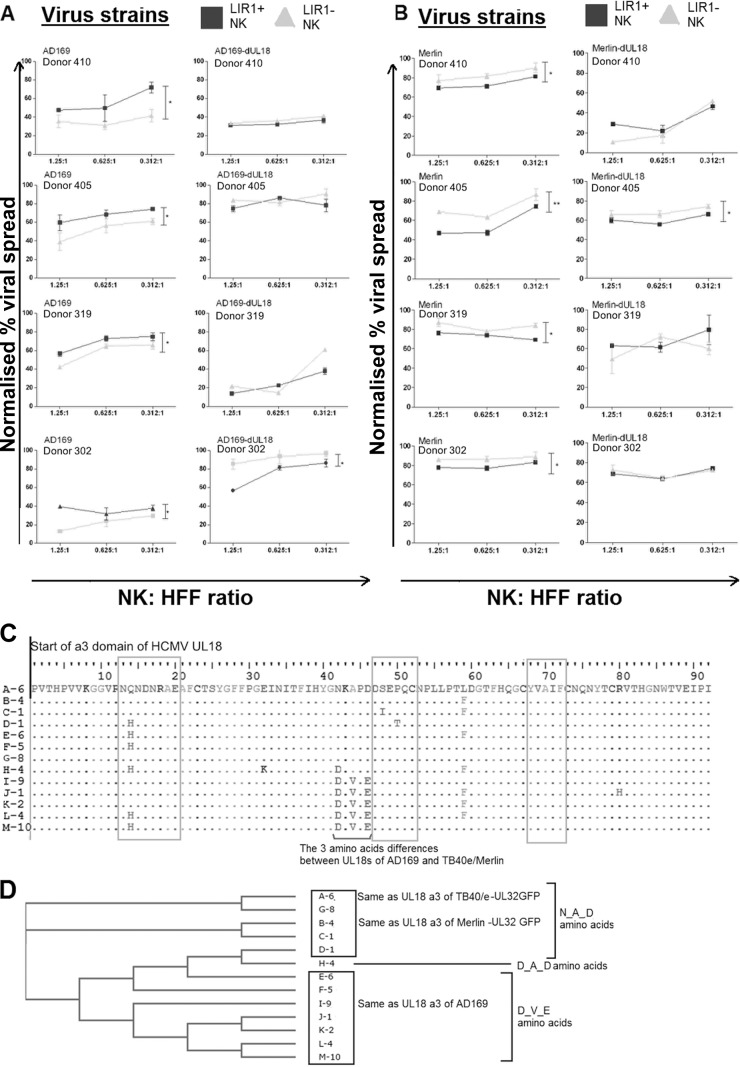
FIG 3.
UL18 proteins from different HCMV strains influence the control of virus dissemination by LIR1+ NK cells. (A) Sixty-seven sequences of HCMV UL18 proteins were identified from the NCBI protein database (www.ncbi.nlm.nih.gov). Six sequences had a truncation and are not included in the alignment. Thirteen unique amino acid sequences of the α3 region of UL18 were identified. Each unique sequence is shown only once in the alignment and is represented by a unique letter. The number following the letter in the sequence name represents the number of times the sequence has appeared in the database. Gray boxes indicate the sites interacting with LIR1 as suggested by the crystal structure (57), while the black line indicates the key differences between the UL18 of AD169 and Merlin strains. (B) Results of the neighbor-phylogenic tree analysis showing the relationship between the sequences based on the protein α3 region. Twenty virus strains have an NKAPED sequence, 37 have DKVPED, and 4 have DKAPDD. (C) NK cells from four different donors (n = 4) were sorted based on LIR1 expression as previously described before being cocultured in a viral dissemination assay with HFFs infected with HCMV strain AD169 or AD169-ΔUL18 at an MOI of 0.1. Infected cells were stained with IE-Alexa Fluor 488 antibodies before analysis using flow cytometry. (D) The viral dissemination assay was repeated with NK cells from four different donors (n = 4) sorted based on LIR1 expression and cocultured with HFFs infected with HCMV strain Merlin or Merlin-ΔUL18 at an MOI of 0.1. Infected HFFs were analyzed on the basis of UL32-GFP fluorescence. In panels C and D, the gray triangles are results from LIR1− NK cells; black squares are the results from LIR+ NK cells. The NK cell-to-target ratios range from 1.25:1, 0.625:1, and 0.312:1. Each data point represents 3 independent readouts. The data were analyzed using two-way ANOVA, error bars represent SEM, and significant results (*, P < 0.05; **, P < 0.01) are indicated.

