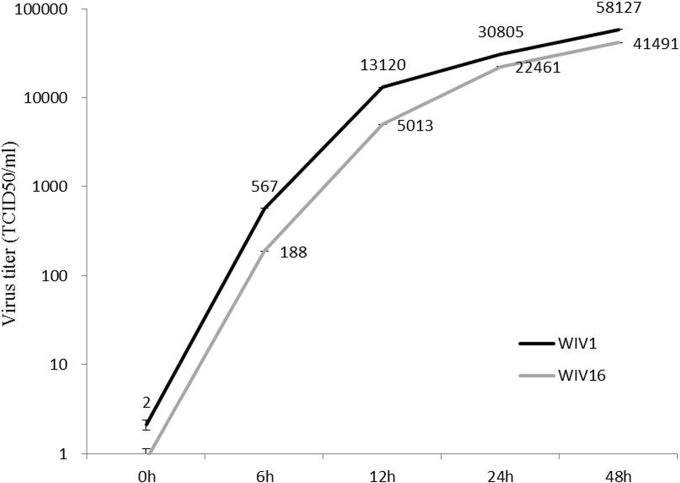
FIG 3.
One-step growth curve of bat SL-CoV WIV16 compared with that of WIV1. Vero E6 cells were infected with WIV16 or WIV1 at an MOI of 1. Supernatants were collected at 0, 12, 24, and 48 h postinfection. The viruses in the supernatant were determined by one-step reverse real-time PCR (n = 3). Virus RNA that had been extracted from a virus with a known titer was used to set up the standard curve. Error bars represent standard deviations. TCID50, 50% tissue culture infective doses.

