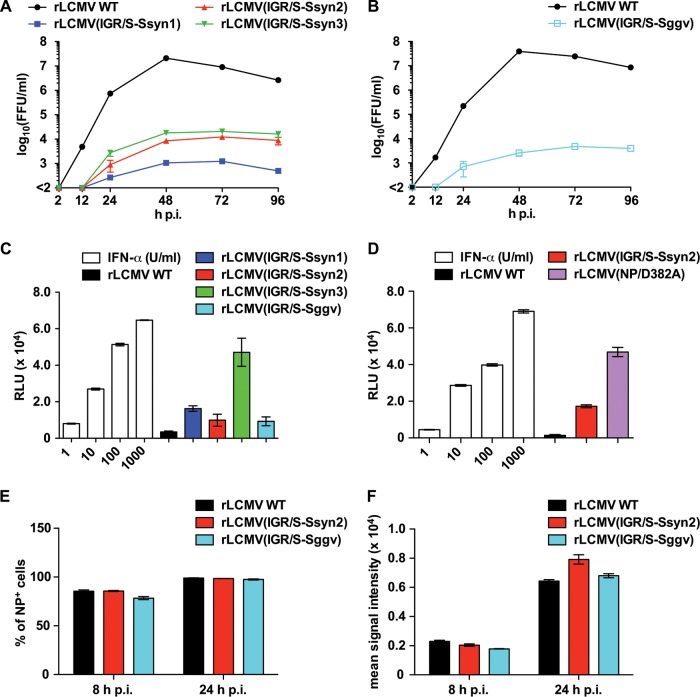
FIG 6.
(A, B) Growth properties in IFN-competent cells of rLCMVs containing an Ssyn (A) or Sggv (B) in their L segments. A549 cells were infected (MOI = 0.01) with the indicated rLCMV, and the virus titers in the TCS were determined at the indicated times p.i. Data represent the means ± SDs from three independent experiments. (C) Ability of the rLCMV(IGR/S-Ssyn) constructs and rLCMV(IGR/S-Sggv) to induce ISRE-mediated reporter gene expression. A549/ISRE-Fluc cells were infected (MOI = 0.1) with the indicated rLCMV or treated with IFN-α at the concentrations indicated on the x axis. At 17 h p.i., the levels of Fluc activity were determined. Values of Fluc activity from mock-infected and untreated cells were subtracted as background activity. Data represent the means ± SDs from three independent experiments. (D) Comparison of the levels of IFN-I production in cells infected with rLCMV(NP/D382A) and rLCMV(IGR/S-Ssyn2). A549/ISRE-Fluc cells were infected (MOI = 0.1) with the indicated rLCMV or treated with IFN-α at the concentrations indicated on the x axis. At 17 h p.i., the levels of Fluc activity were determined. Values of Fluc activity from mock-infected and untreated cells were subtracted as background activity. Data represent the means ± SDs from three independent experiments. (E, F). Comparison of NP expression levels in cells infected with rLCMV/WT, rLCMV(IGR/S-Ssyn2), and rLCMV(IGR/S-Sggv). A549 cells were infected with rLCMV WT, rLCMV(IGR/S-Ssyn2), or rLCMV(IGR/S-Sggv) (MOI = 1). At 8 and 24 h p.i., infected cells were harvested and NP expression was analyzed by flow cytometry. The percentage of NP-positive cells (E) and the mean signal intensity of the NP-positive cell population (F) are shown. Data represent the means ± SDs from three independent experiments.

