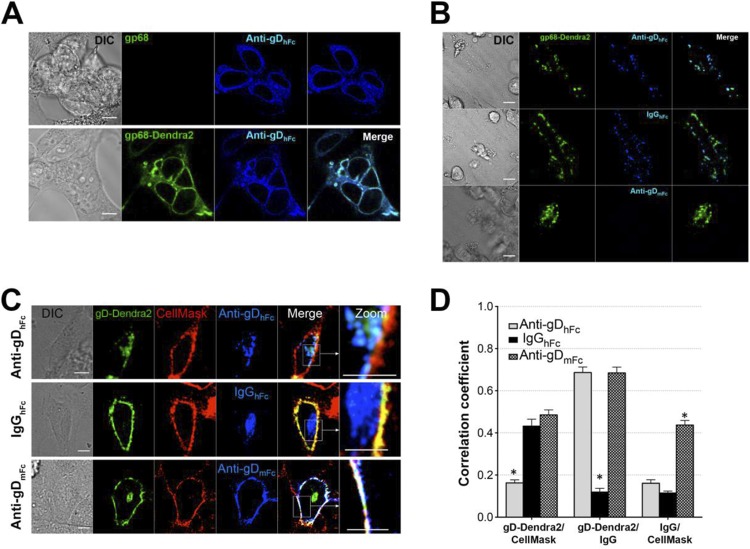
FIG 2.
Characterization of components of the ABB model system. Scale bars, 10 μm. (A) Demonstration that gp68 and gp68-Dendra2 localize similarly in transfected cells. HeLa cells transiently expressing gp68 or gp68 tagged with Dendra2 fluorescent protein (gp68-Dendra2) were fixed in 4% paraformaldehyde (PFA) and incubated with AF647-labeled anti-gDhFc. IgGs were labeled to similar degrees using the Alexa Fluor 647 protein labeling kit following the instructions in the manufacturer's protocol (https://tools.thermofisher.com/content/sfs/manuals/mp20173.pdf). The localizations of gp68 and gp68-Dendra2 were similar, suggesting that both bound human Fc and fusion of Dendra2 to the gp68 cytoplasmic tail did not alter trafficking. (B) Demonstration that gp68 binds human IgG Fc (top and middle panels), but not mouse IgG Fc (bottom). HeLa cells transiently expressing gp68-Dendra2 were incubated with AF647-labeled anti-gDhFc, IgGhFc, or anti-gDmFc for 30 min at 37°C under a 5% CO2 atmosphere and fixed as described for panel A. (C and D) Internalization of gD and IgG under ABB-permissive and nonpermissive conditions. HeLa cells coexpressing gp68 (nontagged) and gD-Dendra2 (green) were pulsed with AF647-labeled IgGs (blue) for 60 min and then treated with AF555-labeled CellMask (red), a plasma membrane marker, for 5 min at 37°C under a 5% CO2 atmosphere. Samples were rinsed to remove excess dye, and 3D imaging (0.5- to 1-μm section thickness and up to 16-μm total depth) was performed using a 63× objective (αPlan-ApoChromat 1.45 oil differential inference contrast [DIC]) and an electron-multiplying charge-coupled device camera (Hamamatsu Photonics) guided by Volocity software on a Perkin-Elmer spinning-disk confocal microscope. (C) Representative confocal slices from cells treated with anti-gDhFc, IgGhFc, or anti-gDmFc. Regions of gD-IgG colocalization appear cyan, regions of CellMask-gD colocalization appear yellow, regions of CellMask-IgG colocalization appear magenta, and regions of triple colocalization (CellMask-gD-IgG) appear white. Experiments were repeated at least three times with analyses of ≥30 cells. (D) 3D thresholded Pearson correlation coefficient analyses for data from ≥30 cells. Correlation coefficients are presented as the mean and standard deviation from experiments repeated at least three times. Asterisks indicate a significant difference of colocalization compared to other members in the same category (P < 0.01).

