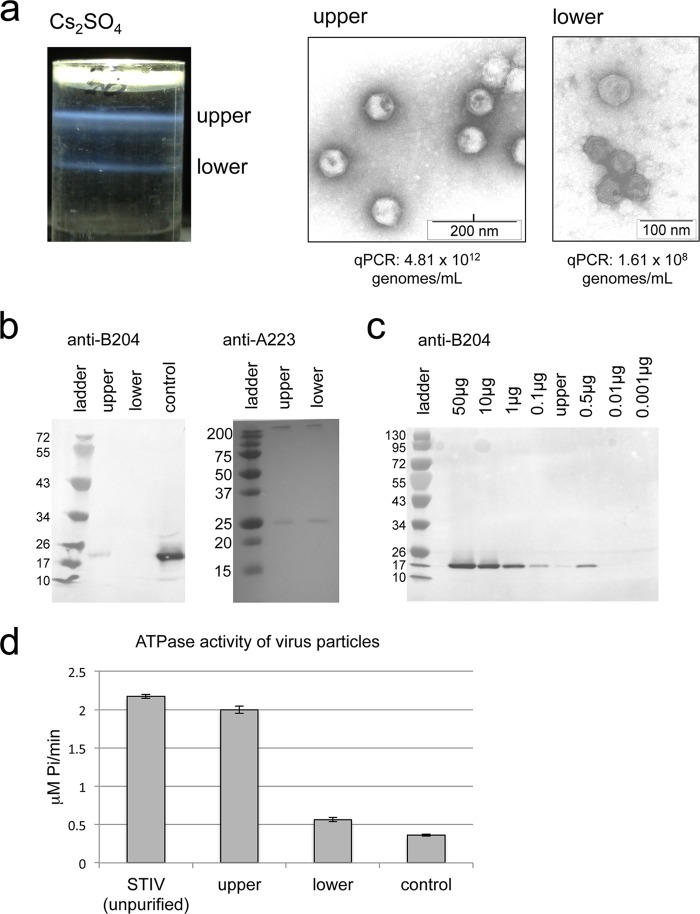
FIG 5.
STIV purified via cesium gradient. (a) Depiction of the resulting bands achieved via cesium gradient for an STIV sample, shown as upper and lower blue bands with accompanying electron micrographs of particles observed for each band. (b) Western blot analysis on protein-normalized samples from the upper and lower bands using antibodies raised against B204 and A223 proteins. E. coli-purified B204 protein is labeled “control.” Molecular mass standards are shown in kilodaltons. (c) Western blot analysis of a series of E. coli-purified B204 standards loaded at various concentrations ranging from 0.001 μg to 50 μg. The upper band of the STIV cesium purification is also loaded on this gel. (d) In vitro ATPase activity comparisons between unpurified STIV (prior to Cs2SO4 separation), the upper band, and the lower band of the cesium gradient. The control sample did not contain any particles; details regarding the preparation of the control sample are described in Materials and Methods.

