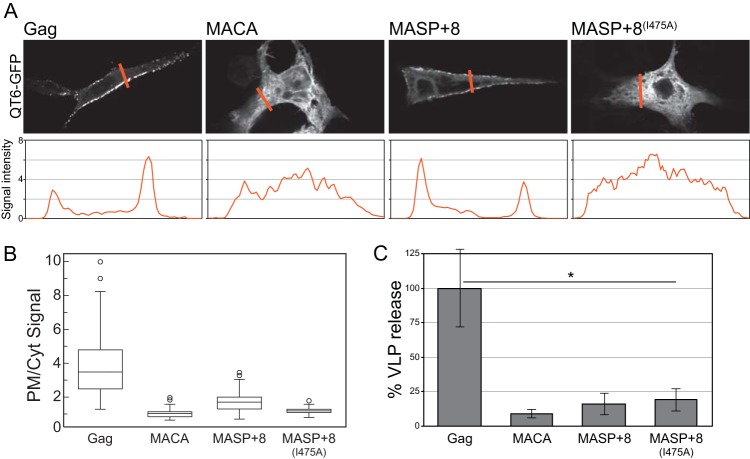
FIG 2.
Cellular localization and VLP release of Gag C-terminal-truncation proteins. All proteins were C-terminally GFP fused. (A) (Top) Representative confocal images of cellular Gag-GFP fluorescence. (Bottom) The orange lines correspond to the signal intensity plot used to quantify the ratio of plasma membrane to cytoplasmic localized protein in panel B. (B) Box plots of no less than 65 plot profile scans for each construct analyzed, as described in Materials and Methods. (C) Percent VLP release compared to Gag (normalized to 100%) as determined by Western blot quantification of supernatant and cytoplasmic Gag. The error bars represent the standard deviations of no less than three replicates (t test; *, P < 0.01).

