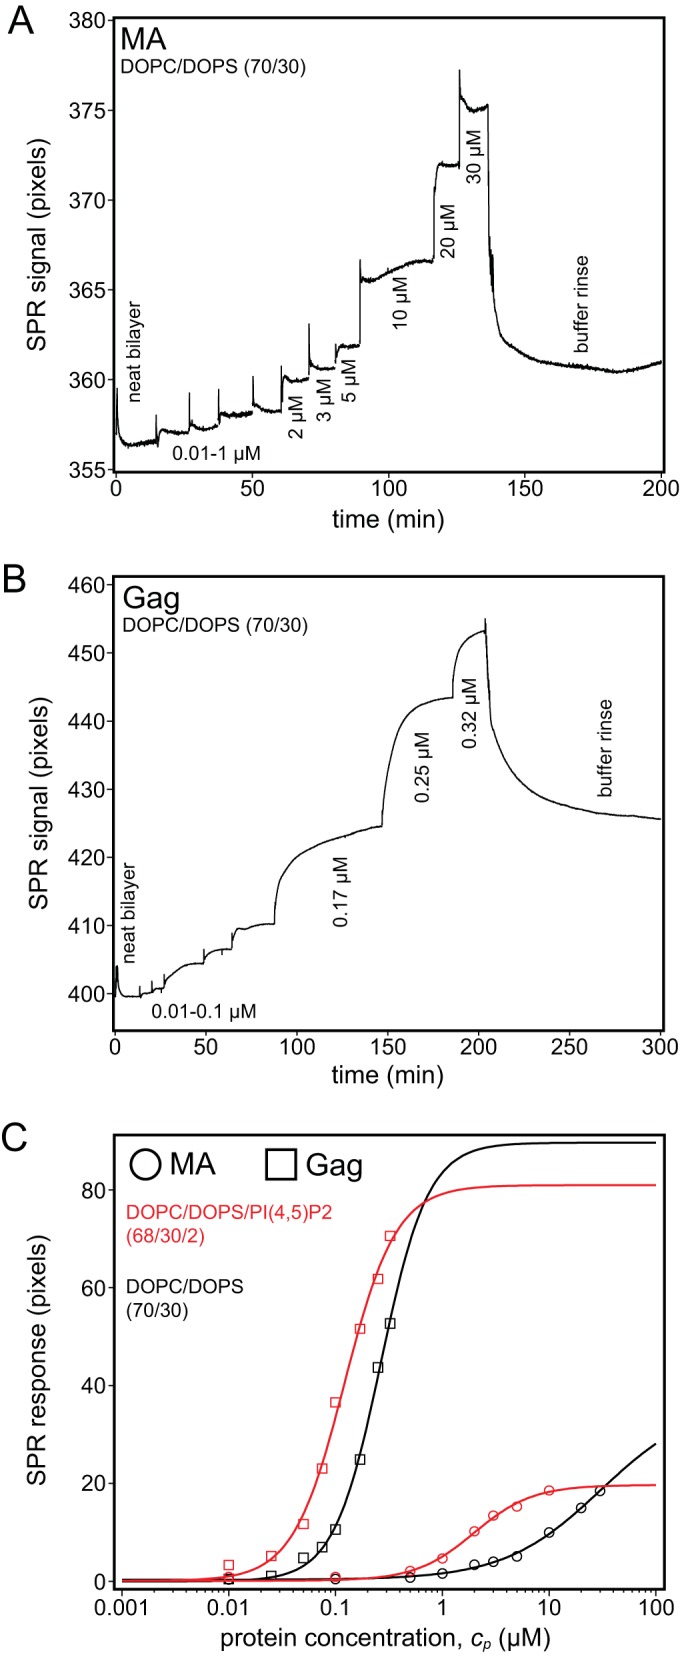
FIG 3.

Surface plasmon resonance of Gag and the Gag MA domain. Protein binding affinities for stBLMs were quantified in 50 mM NaCl (pH 8) at a fixed PS concentration of 30%. (A and B) Exemplary SPR binding curves (raw data) of MA (A) and Gag (B) to DOPC/DOPS (70/30) stBLMs in which neat bilayers were exposed to increasing protein concentrations, followed by a final rinse. The plateaus correspond to equilibrium responses at given protein concentrations. Gag remained bound to the membrane after the buffer rinse, while MA was almost completely removed. (C) Gag and MA binding to DOPC/DOPS stBLMS either with (red) (2 mol%) or without (black) PI(4,5)P2. The MA data in panel A are well described by a Langmuir isotherm (Hill equation with N equal to 1). In contrast, the Gag data in panel B could be fitted only with Hill exponents where N was greater than 1 (provided in Table 2), which indicates cooperative membrane binding. Measurements were repeated no less than two times.
