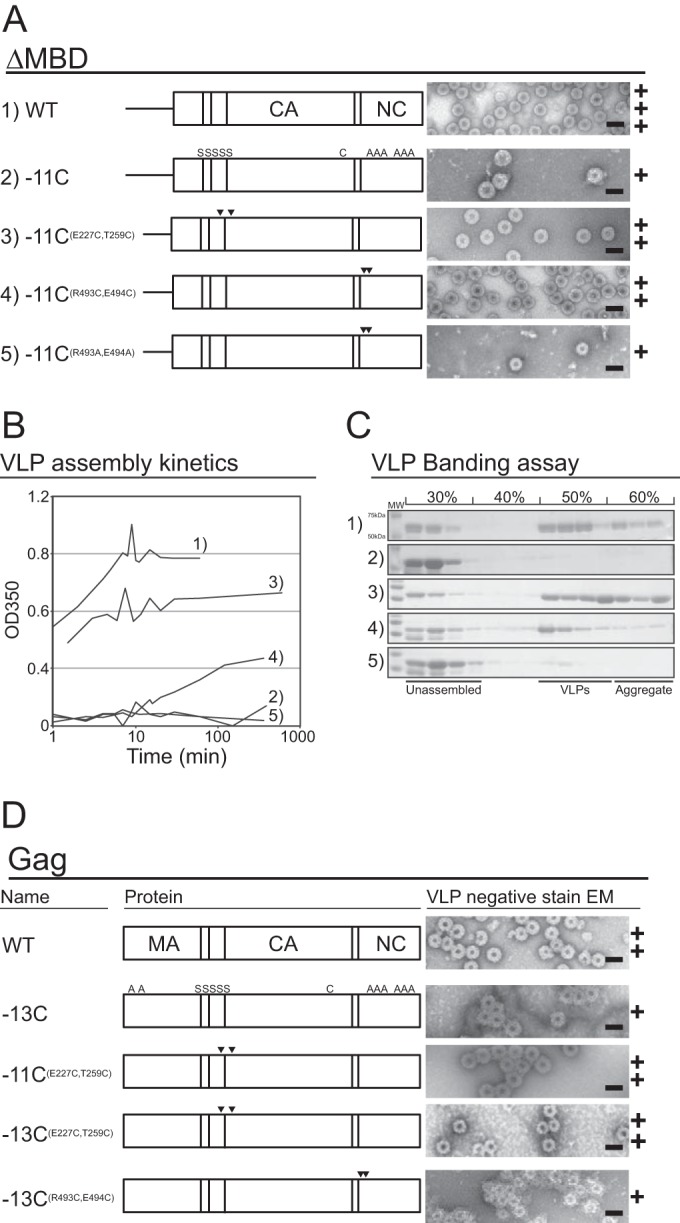
FIG 4.

In vitro assembly of ΔMBD and Gag cysteine mutants. The numbers 1 to 5 in panels A to C correspond. In panels A and D, the letters S and A are minus cysteine, arrowheads are plus cysteine, and C corresponds to the endogenous cysteine in CA (25). (A) Schematic of purified ΔMBD proteins (left) and representative negative-stain EM images (right). (B) Assembly kinetics of ΔMBD constructs measured by light scattering. (C) VLP banding of ΔMBD constructs on a 30 to 60% (wt/wt) sucrose step gradient. Unassembled and aggregated protein fractions and VLPs are identified, and the molecular weight bands identified for sample 1 are the same for all samples. (D) Schematic of purified Gag proteins (left) and representative EM images (right). Scale bars, 100 nm. The plus symbols represent qualitative estimates of particle numbers per EM grid (+, tens; ++, hundreds; +++, thousands).
