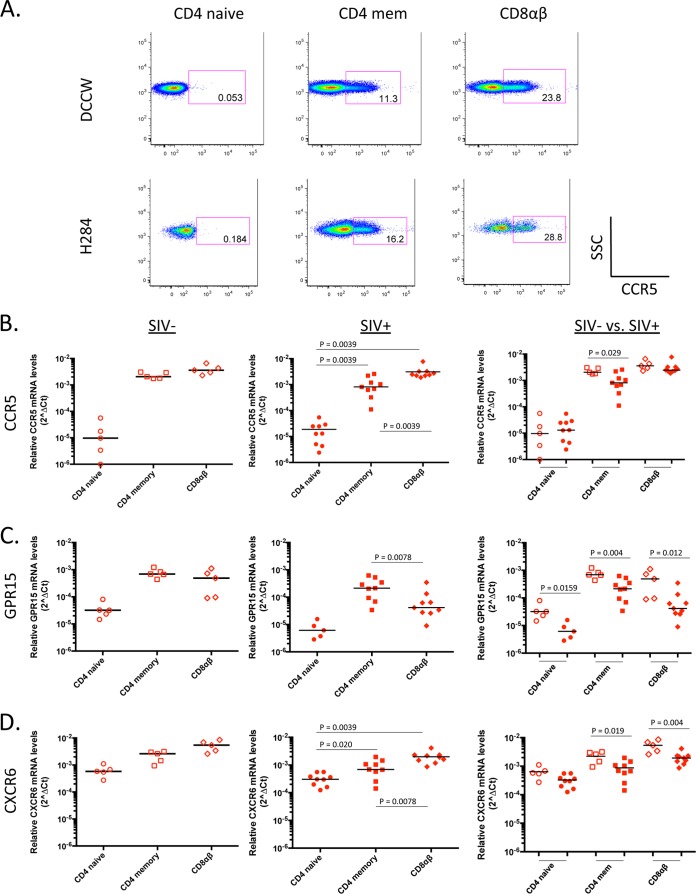
FIG 5.
Relative CCR5, GPR15, and CXCR6 mRNA levels in sorted RM CD4+ and CD8+ T cell subsets from uninfected and SIV-infected RM. (A) Representative FACS plots for two uninfected RM, showing CCR5 protein expression levels on CD4+ (naive and memory) and CD8+ T cell subsets. SSC, side scatter. Quantitative RT-PCR was used to determine relative CCR5 (B), GPR15 (C), and CXCR6 (D) mRNA levels in sorted RM CD4+ and CD8+ T cell subsets from uninfected (left panels; open symbols) and SIV-infected (middle panels; filled symbols) animals. The median coreceptor mRNA level is shown for each subset examined. For panels B to D, left and middle panels, P values were calculated using the Wilcoxon test to determine the level of significance of differences in coreceptor mRNA levels between various cell subsets. For panels B to D, right panels, P values were calculated using the Mann-Whitney test to determine the level of significance of differences in coreceptor mRNA levels between uninfected and SIV-infected RM. P values that reached statistical significance (P ≤ 0.05) are displayed on graphs.

