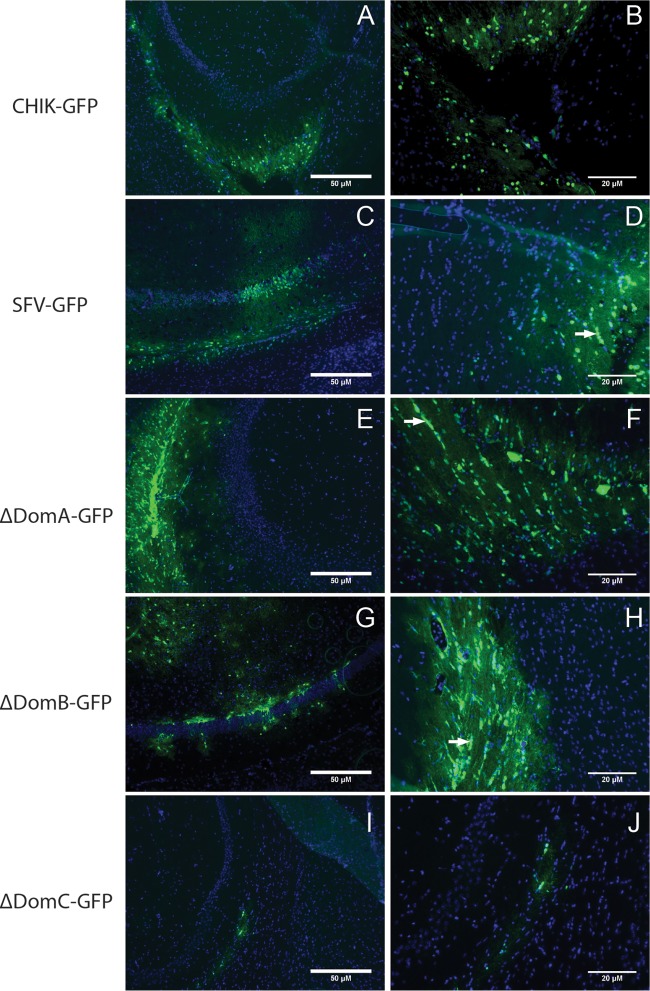
FIG 8.
Distribution of CHIKV/SFV chimeras in the mouse brain. GFP expression was used to monitor tropism of CHIKV/SFV chimeras in the brains of A129 mice. Cryosectioned tissues were cut using a cryostat to 10 μm and placed onto positively charged slides. GFP expression was monitored using an Evos FL microscope with either a ×10 (A, C, E, G, and I) or ×20 (B, D, F, H, and J) objective lens. Scale bars represent 50 μm (A, C, E, G, and I) and 20 μm (B, D, F, H, and J). Blue color represents cellular nuclei stained with DAPI. White arrows represent chains of cells that have an oligodendrocyte-like morphology.

