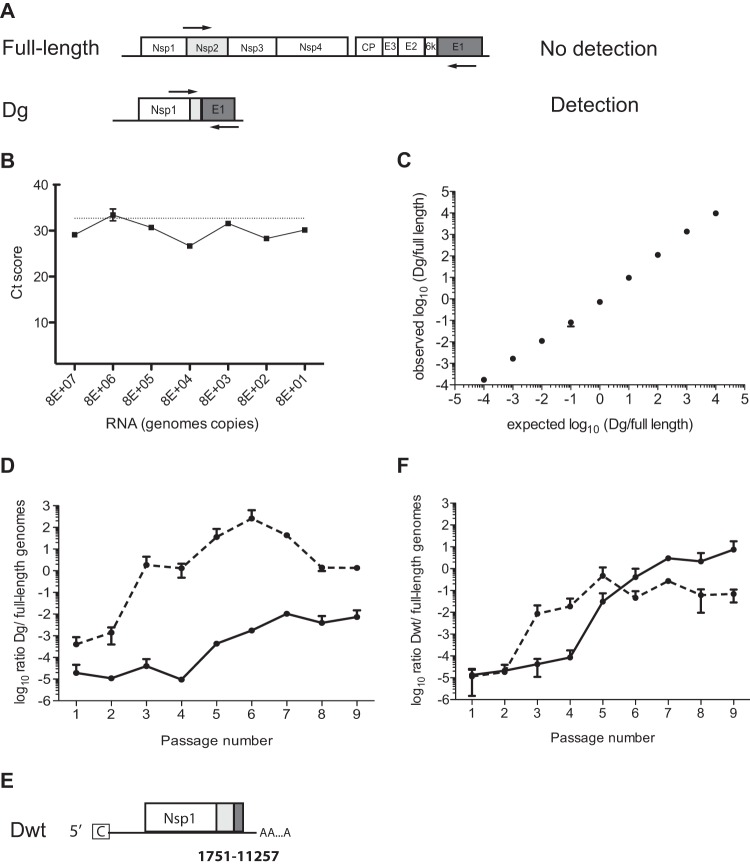
FIG 3.
SINV-G mutator RdRp produces more defective particles. (A) In order to detect only Dg in the sample, primers 1634F and 10565R were chosen on each side of the breakpoint (arrows). (B) Increasing amounts of in vitro-transcribed full-length RNA was assessed by qRT-PCR using these Dg primers. Regardless of the amount, the signal remained at the same level as that of the water-only control (dashed line). Ct, cycle threshold. (C) In vitro-transcribed RNAs of the full-length genome and Dg were mixed at different ratios and then measured by qRT-PCR using a primer pair targeting only the full-length genome and the aforementioned primer pair detecting only the Dg genome. The measured ratios (observed) were compared to input ratios (expected). Mean values and standard errors of the means are indicated (n = 3). (D) The ratio of the Dg genome to full-length genome was quantified by qRT-PCR in samples of SINV-WT (solid line) and SINV-G (dashed line) passaged at an MOI of 25, as shown in Fig. 1D. Mean values and standard errors of the means are shown (n = 3). (E) Schematic of defective genome Dwt, as described in the legend of Fig. 2C. (F) Ratios of Dwt genomes to full-length genomes were quantified by qRT-PCR in samples passaged at an MOI of 25 of SINV-WT (solid line) and SINV-G (dashed line), as shown in Fig. 1D. Mean values and standard errors of the means are shown (n = 3).

