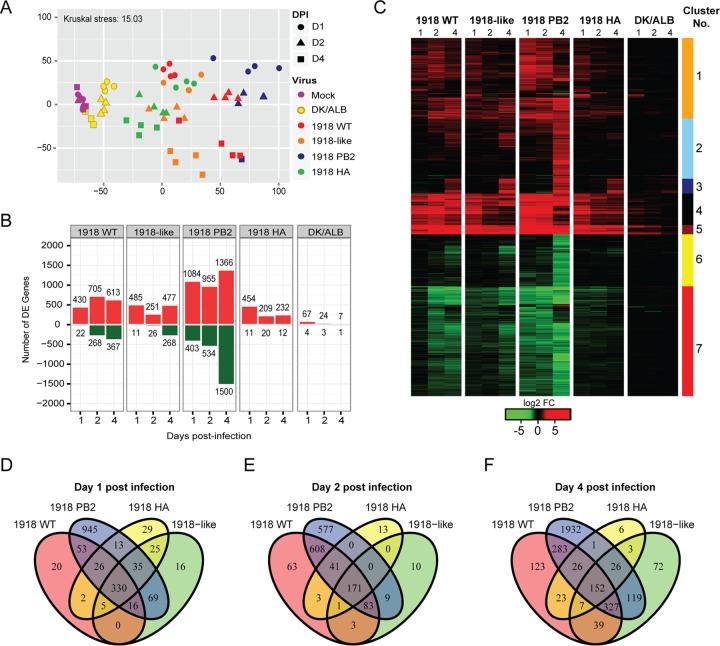
FIG 2.
Global analysis of the transcriptional profile of 1918 and 1918-like avian virus infected lungs. (A) Multidimensional scaling (MDS) representation of the similarities in the lung transcriptional profiles elicited by viral infection over time. Each biological replicate is represented as a single point, where color denotes virus infection and shape denotes day postinfection. The quality of the representation is provided by the Kruskal stress value, with a low percentage of Kruskal stress (15.02%) suggesting a faithful two-dimensional representation of global transcriptional differences between viral strains. (B) Number of highly differentially expressed (DE) genes following virus infection relative to time-matched mocks. Differential gene expression cutoff was set to |log2 FC| >3 and a q-value < 0.05 calculated using a moderated t test with subsequent Benjamini-Hochberg correction. (C) Hierarchical clustering of the union (4,013 genes) of DE genes based on Euclidean distance reveals distinct modules of gene expression in influenza-infected lungs. A heat map represents the average expression intensities for each infectious condition and time point relative to the average of time-matched mock-infected samples. (D to F) Time- and strain-dependent distribution of DE genes following infections with influenza viruses. Venn diagrams show the overlap of DE genes at day 1 (D), day 2 (E), and day 4 (F) postinfection.

