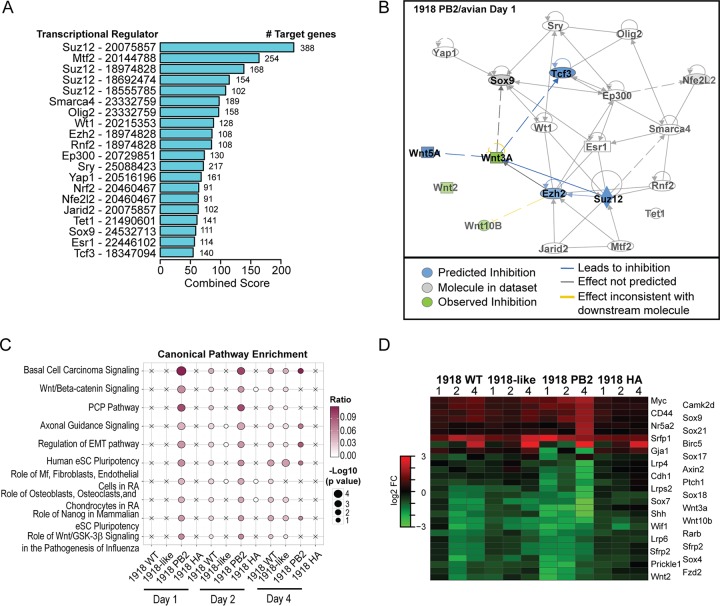
FIG 5.
Downregulation of Wnt signaling-associated genes contributes to viral pathogenesis. Functional analysis of downregulated genes following viral infection demonstrates the inhibition of Wnt signaling genes. (A) Ranking of the top transcriptional regulators of downregulated genes in the infected lung during the course of infection. Regulators were identified using ChEA. Bar graphs represent the combined scores for each regulator (bar length) and the number of target genes associated with each regulator. The PMID for the specific gene sets associated with each transcriptional regulator is shown. (B) IPA-generated regulatory network analysis of the top-ranked TFs. Each node represents a transcription factor or regulatory cytokine. Arrows indicate the relationship between TFs. Color indicates the predicted (blue) or observed (green) inhibition of molecule activity. (C) Canonical pathways associated with Wnt genes. Pathway enrichment was reported as (−log10 P value). Bubbles represent significant pathway enrichment, as determined by Fisher exact test. (D) Heat map of expression intensities of Wnt signaling-associated genes.

