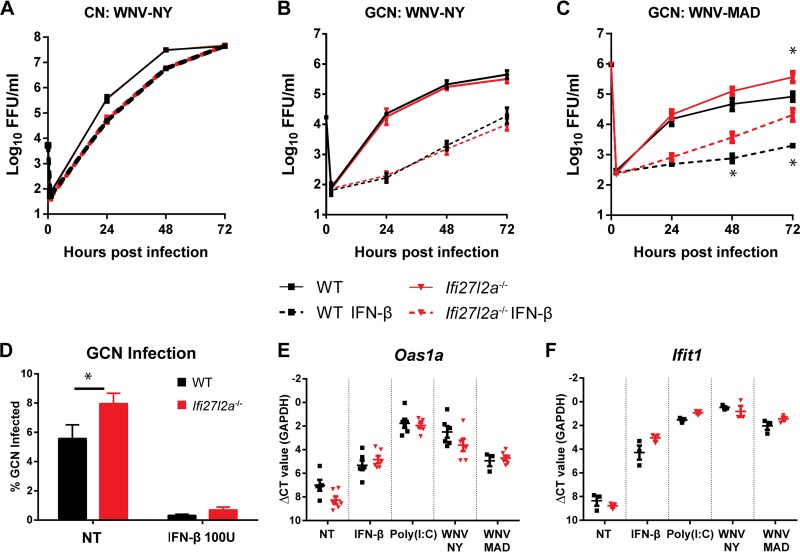
FIG 8.
Viral infection of WT and Ifi27l2a−/− primary neurons. Primary neuron cultures were generated from WT and Ifi27l2a−/− mice and infected with WNV-NY or WNV-MAD. Cell supernatants were harvested at the indicated time points and titrated in a focus-forming assay. (A to C) CN (A) and GCN (B and C) were infected at the following MOIs: WNV-NY, 0.01; WNV-MAD, 0.1. In some experiments, GCN and CN were pretreated with IFN-β for 24 h (for CN, 150 U/ml for WNV-NY; for GCN, 150 U/ml for WNV-NY or 100 U/ml for WNV-MAD). (D) WT and Ifi27l2a−/− GCN were infected with WNV-MAD for 72 h, and cells of infected neurons (microtubule-associated protein 2 positive [MAP2+]) were counted by automated high-throughput imaging. (E and F) WT and Ifi27l2a−/− GCN were analyzed by qRT-PCR for expression of Oas1a (E) and Ifit1 (F). Viral replication data were analyzed at each time point and for each treatment by Student's t test for each treatment group (*, P < 0.05; n = 3 for independent replicates). GCN infection assay results were analyzed by Student's t test (two experimental replicates; three to four sample wells per replicate) (*, P < 0.05). For high-throughput imaging, three wells per treatment group were analyzed for each biological replicate (n = 3). For each well, 60 computer-randomized images were collected and analyzed by the use of a GE IN Cell 2000 imager and IN Cell software. qRT-PCR data were analyzed by Student's t test with correction for multiple comparisons by the Holm-Sidak method (*, P < 0.05). NT, not treated.

