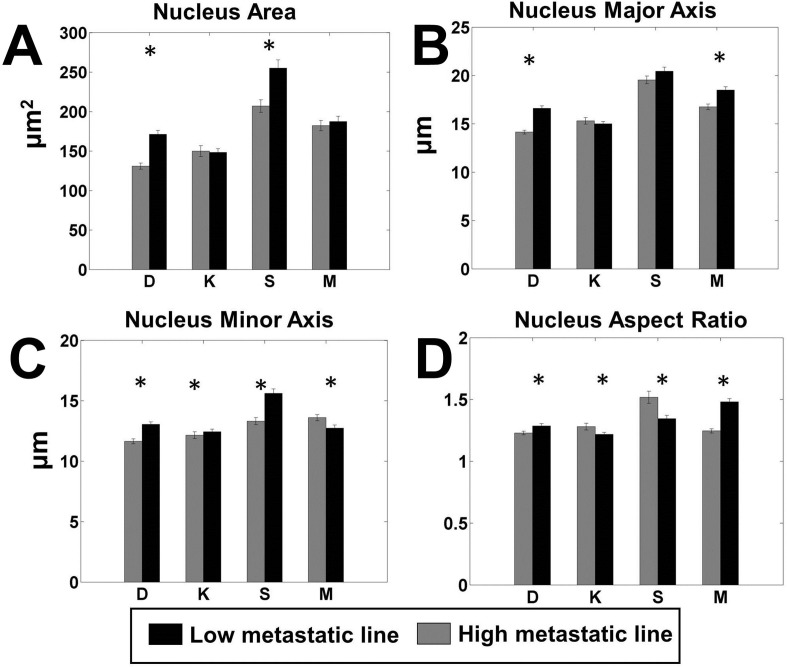
Fig. 3.
Pairwise comparison of the most significant parameters of nucleus shape. Each panel shows the comparison between high metastatic (grey) and low metastatic (black) cell lines for a single significant parameter. The paired lines are indicated by letters as follows. D: DUNN and DLM8; K: K12 and K7M2; S: Saos2 and SAOS-LM7; M: MG63 and MG63.2. (A) Nuclear area, (B) major axis of the nucleus, (C) minor axis of the nucleus and (D) aspect ratio of the nucleus. n=100 for each cell line on each surface. *P<0.05 by two-tailed t-test satisfying the Holm–Bonferroni criteria for all variables (Table S3).

