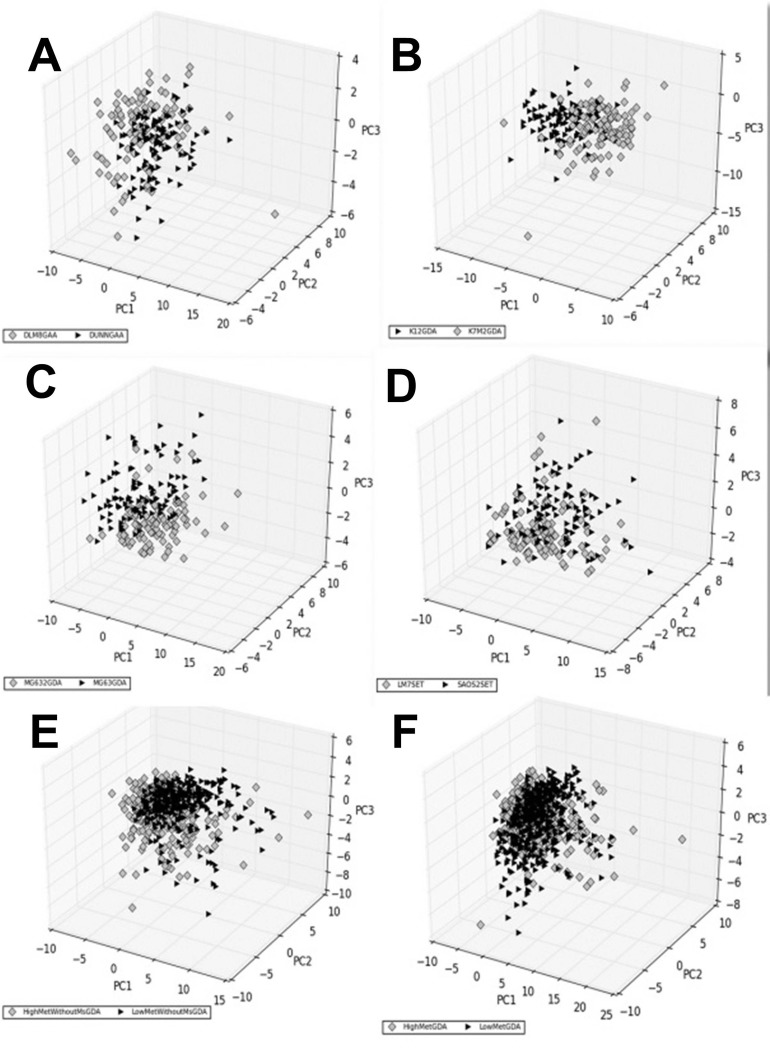
Fig. 4.
Principal components of shape characteristics. The shape characteristics data for each cell is projected onto the first three principal components of the combined data of each comparison. In this figure, comparisons for each paired cell lines that performed best are shown, as determined by visual inspection and global comparisons. The grey diamonds represent the high metastatic cell line(s) while the black triangles represent the low metastatic line(s). Each panel represents one comparison as follows: (A) DUNN vs DLM8 on GAA, (B) K12 vs K7M2 on GDA; (C) MG63 vs MG63.2 on GDA; (D) Saos2 vs SAOS-LM7 on SET; (E) all type-1 low metastatic lines versus high metastatic lines on GDA and (F) all low metastatic versus high metastatic (i.e. both types combined) on GDA. n=100 for each cell line on each surface.

