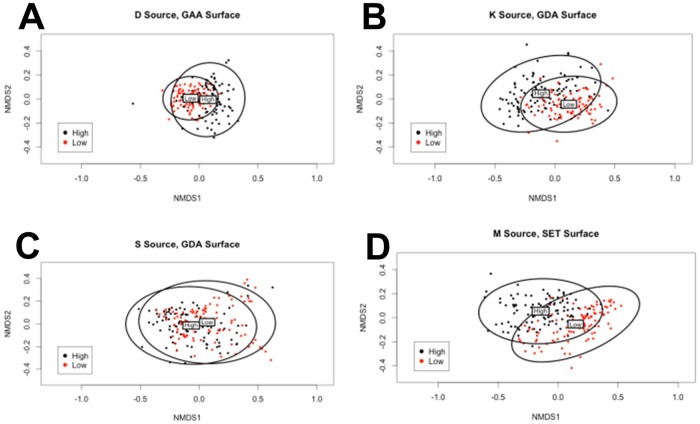
Fig. 5.
Nonmetric multidimensional scaling. Each panel represents an ordination pattern formed by comparison of geometric characteristics of a low metastatic and a high metastatic cell line on the surface that showed the highest R2 value for the pair. Each point represents the shape parameters of a single cell, plotted in black if high metastatic and red if low metastatic. The ellipses represent 95% confidence intervals with the labels ‘High’ and ‘Low’ marking the centroid positions of the corresponding cell line. The comparisons are as follows: (A) DUNN (low) and DLM8 (high) on GAA; (B) K12 (low) and K7M2 (high) on GDA; (C) Saos2 (low) and SAOS-LM7 (high) on GDA and (D) MG63 (low) and MG63.2 (high) on SET. n=100 for each cell line on each surface.

