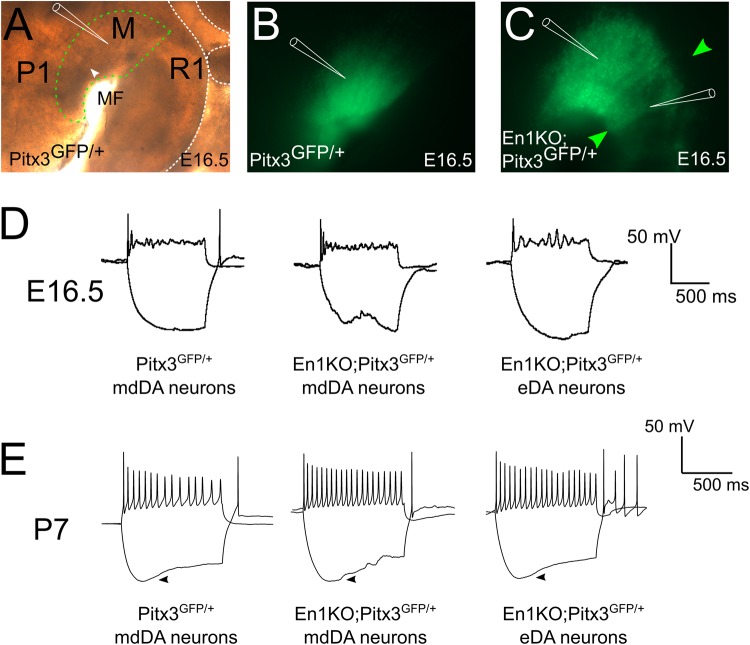
Fig. 2.
eDA neurons are electrophysiologically identical to control mdDA neurons. (A) Bright field image of a medial plane of a hemitube at E16.5, including a demarcation of mdDA area by a green dotted line. P1, prosomere 1; M, midbrain; R1, rhombomere 1; MF, mesencephalic flexure. White arrowhead shows the location of the retroflexus. The white dotted line marks the outline of the mesencephalic tissue. (B,C) Visualization of mdDA area by endogenous Pitx3GFP signal in control (B) and En1KO;Pitx3GFP/+ (C) animals, including eDA neurons (green arrowheads) in hemitubes at E16.5. Schematic electrodes in A-C indicate locations of recordings. (D,E) Traces at E16.5 (D) and P7 (E) exemplify the absence of dissimilarities between control mdDA neurons, En1KO;GFP/+ mdDA neurons and En1KO;GFP/+ eDA neurons. The presence of the hyperpolarizing sag reveals the dopaminergic characteristic of the h-current in all three conditions at P7 (arrowhead).

