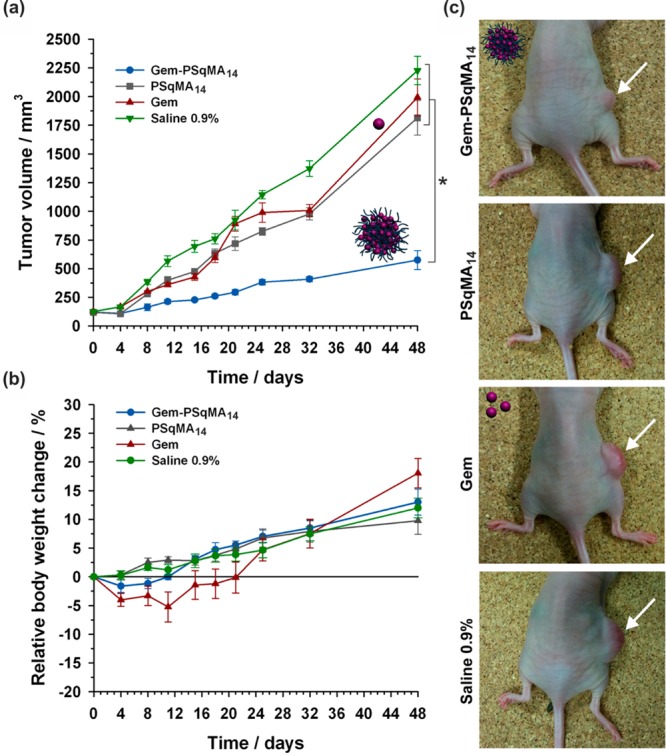
Figure 12.

Evolutions of (a) tumor volume and (b) relative body weight change with time following intravenous injection (on days 0, 4, 8, 11, 15, 18, 21 and 25) of Gem (green −▼–, 3.4 mg·kg–1), Gem-PSqMA14 nanoparticles (blue −●–, 3.4 mg·kg–1 Gem-equivalent dose), control (gray −■–, saline 0.9%) and PSqMA14 nanoparticles (red −▲–, same dose of polymer as Gem-PSqMA14). (c) Pictures showing the position of the implanted tumor on representative mouse at day 32 for all treatments. Adapted with permissions from ref (75).
