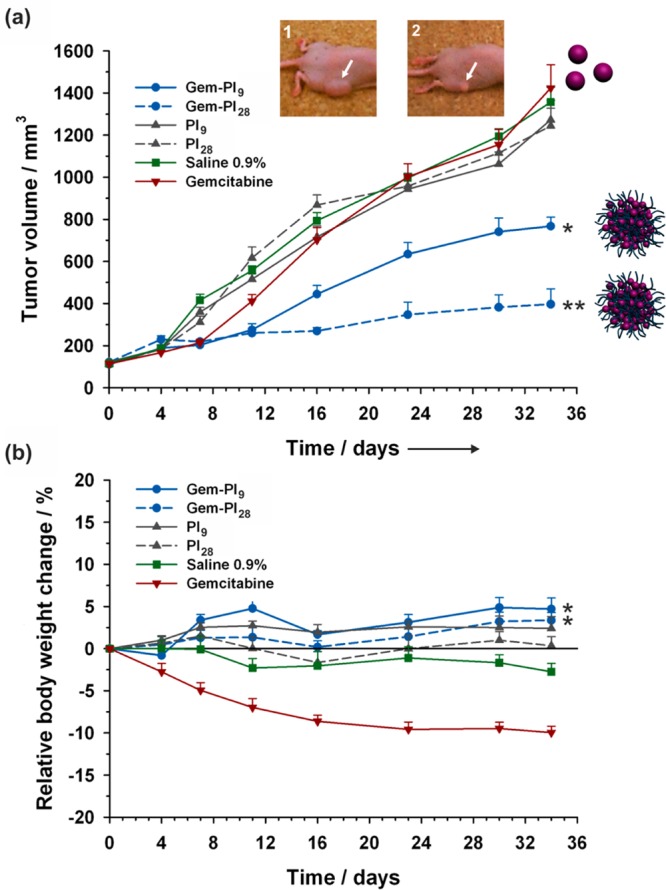
Figure 14.

Evolutions of (a) tumor volume and (b) relative body weight change with time following intravenous injection (on days 0, 4, 8 and 12) of Gem (red −▼–, 7 mg·kg–1), Gem-PI nanoparticles [blue −●– (Gem-PI9) and blue --●-- (Gem-PI28), 7 mg·kg–1 Gem-equivalent dose], control (green −■–, saline 0.9%) and PI nanoparticles [gray −▲–, (PI9) and gray --▲--, (PI28), same dose of polymer as Gem-PI]. White arrows point to the position of the implanted tumor on representative mouse at end point for Gem-treated group (inset 1) and Gem-PI28-treated group (inset 2). Adapted with permissions from ref (76).
