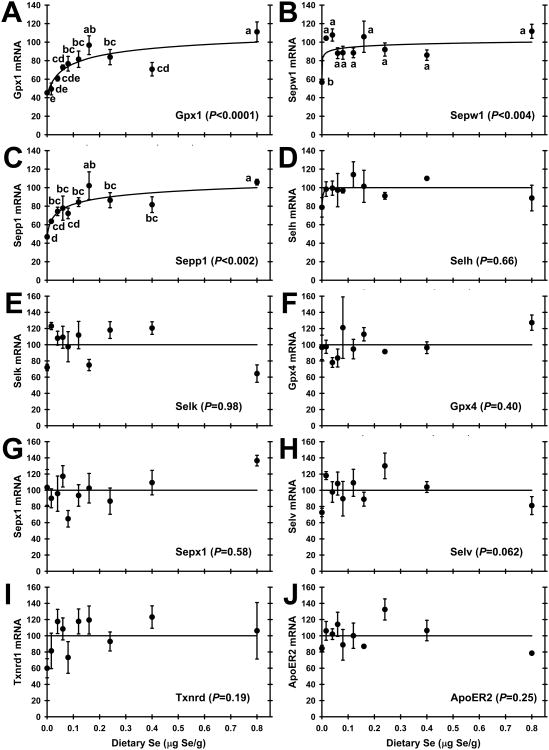
Figure 2.
Effect of dietary Se concentration on selenoprotein transcript abundance. A. Gpx1; B. Sepw1; C. Sepp1; D. Selh; E. Selk; F. Gpx4; G. Sepx1; H. Selv; I. Txnrd1; J. ApoER2. Values are means ± SEM; n = 3/diet. Gpx1, Sepw1, and Sepp1 mRNA levels were significantly regulated by dietary Se level at the indicated level of significance; values with a common letter are not significantly different (P < 0.05). For transcripts that were not significantly regulated by dietary Se, a line in each panel indicated the mean of all normalized values.

