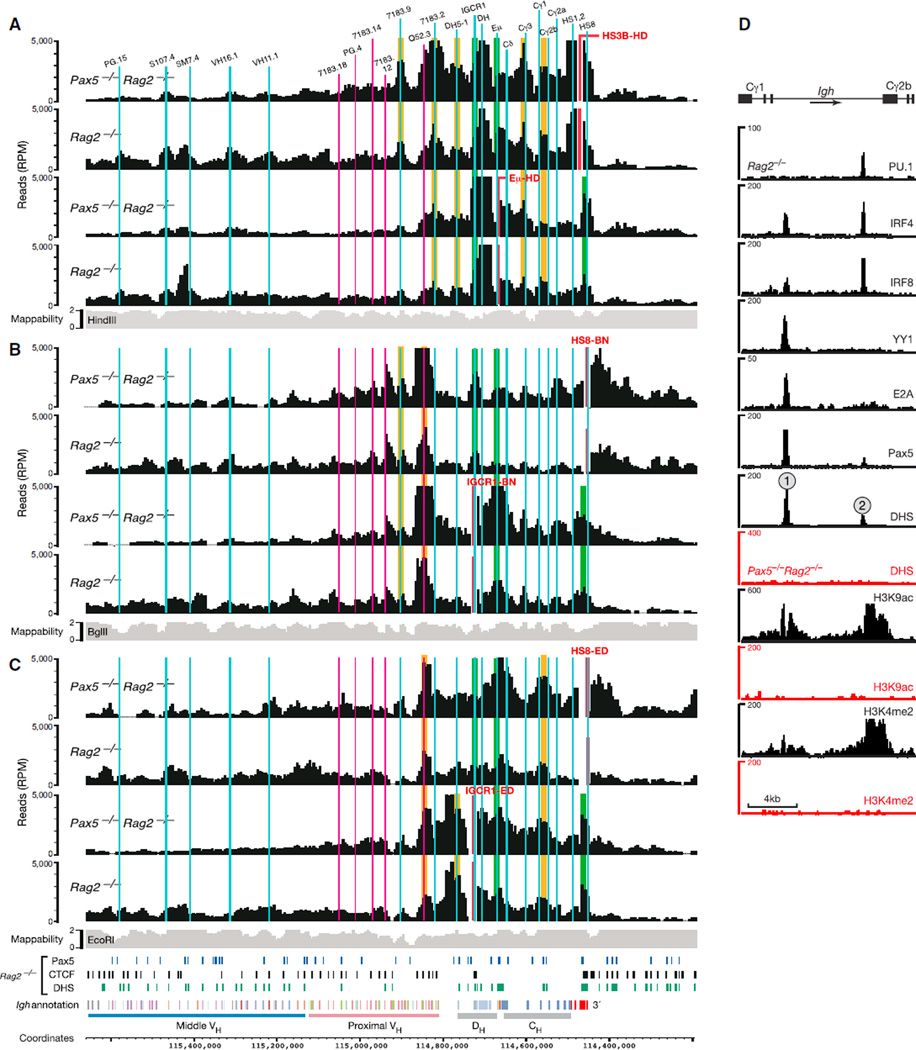
Figure 2. Loop Formation in the 3′ Proximal Igh Region.
(A–C) 4C-seq interaction patterns revealed by the indicated viewpoints (red) in short-term cultured Pax5−/−Rag2−/− and Rag2−/− pro-B cells. Vertical lines indicate the positions of relevant VH, DH, and CH gene segments as well as IGCR1, Eµ, and DNase I hypersensitive sites constituting the 3′RR (HS1–HS4) and 3′CBE (HS5–HS8) regions. Previously known and newly identified interactions are highlighted in green and orange, respectively. See legend of Figure 1 for further explanations. The data in (A) are based on average values of three independent experiments, and the results shown in (B) and (C) are derived from one experiment.
(D) Characterization of the Cγ1-Cγ2b region. The sequences between the Cγ1 and Cγ2b gene segments were analyzed for binding of the indicated transcription factors and the presence of DHS sites and active histone modifications (H3K4me2 and H3K9ac) by deep sequencing of Pax5−/−Rag2−/− (red) and Rag2−/− (black) pro-B cells (Revilla-I-Domingo et al., 2012).
See also Figure S2.

