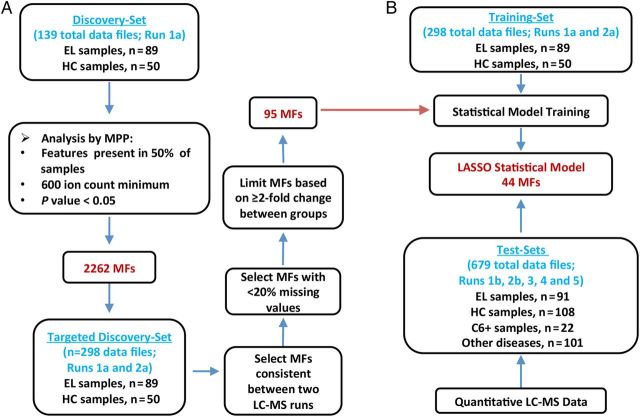
Figure 1.
Work flow for the discovery and testing of a serum biosignature that differentiates early Lyme disease (EL) from healthy controls (HC). A, Liquid chromatography-mass spectrometry (LC-MS) data from an initial discovery-set of samples (left) comprised of 89 EL patients and 50 HC (15 endemic and 35 nonendemic controls) (see Supplementary Material) were processed with the Molecular Feature Extractor algorithm tool of the Agilent MassHunter Qualitative Analysis software. The molecular features (MFs) were aligned between data files with a 0.25 minutes retention time window and 15 ppm mass tolerance. To reduce selection of MFs biased by uncontrolled variables (diet, other undisclosed illnesses, etc.), only those MFs present in greater than 50% of samples of at least one group and that differed between the groups with a significance of (P < .05) were selected. Agilent Mass Profiler Pro (MPP) software was used to identify MFs that differ between the 2 groups and this analysis resulted in 2262 MFs. A second LC-MS analysis of the same discovery-samples was performed. The abundance values for the 2262 MFs in both LC-MS data sets were combined to form the targeted discovery-sample data set. MFs were down-selected based on consistency between LC-MS runs and at least a 2-fold change in abundance from the median of the comparator group in replicate LC-MS analyses. This allowed for selection of an EL biosignature consisting of 95 MFs that were applied to statistical modeling. B, A training-data set along with the 95-MF biosignature list was used to train multiple statistical models [15]. The abundance values of targeted MFs used for model development were acquired with the Agilent MassHunter Quantitative Analysis software. Data from test-samples not included as samples for the training-data set were blindly tested against the statistical models. LASSO modeling selected 44 MFs for the refined biosignature and provided the most accurate classification of samples.

