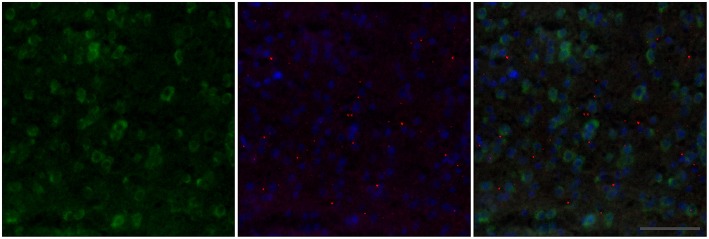
Figure 2.
Example double-label fluorescence in situ staining of the BSTm of a Control male. In the first panel, V1aR expressing cells are labeled in green. In the second panel, punctate nuclear-staining for ZENK is shown in red, with DAPI nuclear stain shown in blue. The third panel shows all three—V1aR, ZENK, and DAPI—combined. The frame is 200 × 200 μm and the scale bar is 50 μm.

