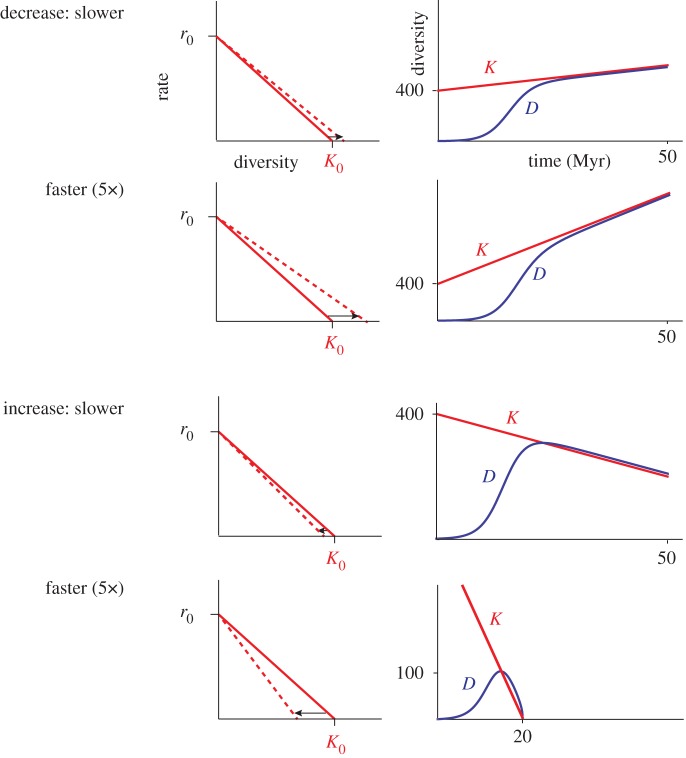
Figure 5.
Diversity trajectories (right panels) when the carrying capacity changes linearly with time via an increase or decrease in the strength of per-species diversity dependence, γ(t), the effect of crowding in inhibiting diversification (left panels). The diversity curves were generated solving equation (4.2) with Mathematica 10.1.0.0. The initial values of r0, γ, and thus the initial carrying capacity (Kt=0) of 400, were the same as those used in figure 4. Similarly, we used the same α values as in figure 4, which, given that α = α′/γ in equation (4.2) (see appendix A), translated into a value of α = 4 for the slower rates (a 1% change/million years), and α = 20 species for the faster rates (5% change/million years). (Online version in colour.)

