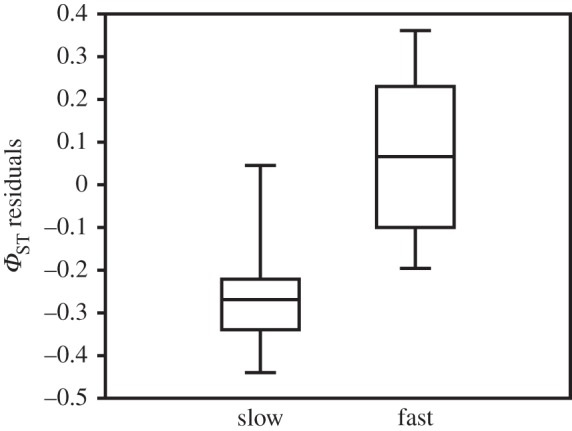
Figure 2.

Boxplot of ΦST residuals from the correlation to geographical distance (see electronic supplementary material, S1.3). There was a significant difference between slow-evolving populations with fewer than 10 potential generations per year, and fast-evolving populations with more than 10 potential generations per year (Mann–Whitney U permutation test, p = 0.0001).
