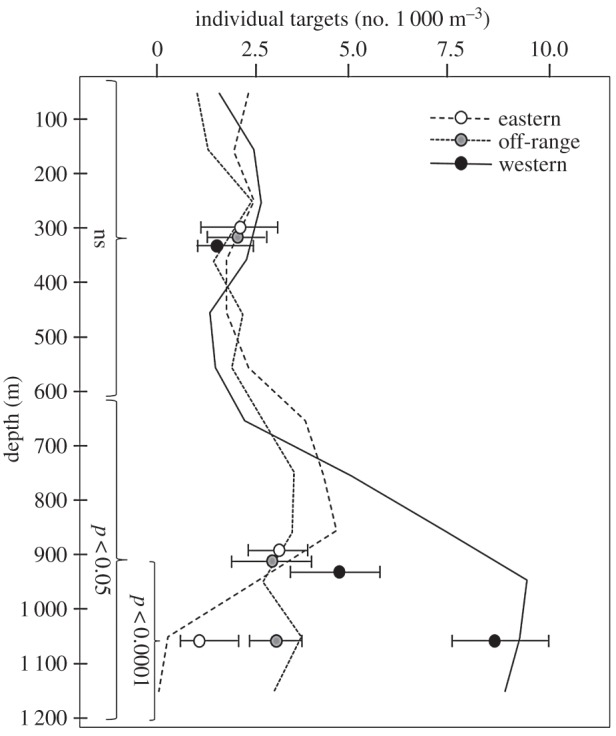
Figure 3.

The density of individual targets as a function of depth range and sampling zone is shown over 100 m depth bins. Values are shown averaged over the upper 600 m of the water column, 600–1 200 m, and 900–1 200 m for each zone. Error bars show the total range of values for transects in that zone. Significance levels for post-hoc analysis of the effects of sampling zone are shown for each panel.
