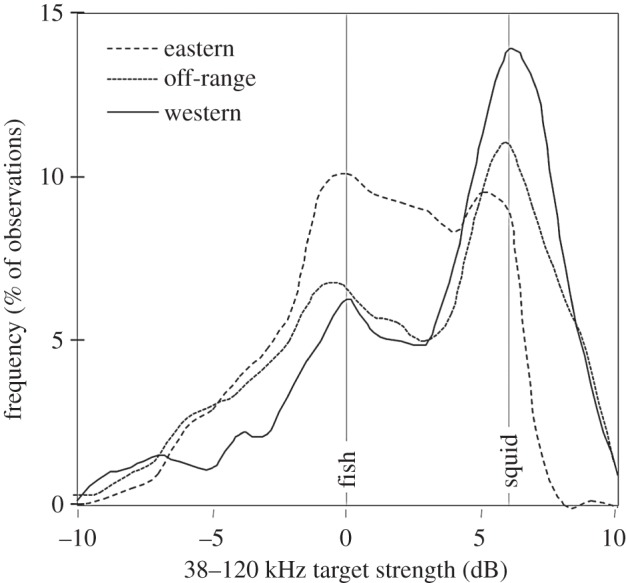
Figure 4.

Smoothed histograms of the frequency response of individual targets detected between 900 and 1 200 m as a function of sampling zone. The expected frequency response for fish (0 dB) and squid (6 dB) are indicated by grey lines. The y-axis is the per cent of observations within each zone. This allows the relative proportion of different scatters to be observed across zones.
